As the digital landscape continues to evolve, the need for effective traffic inspection tools becomes crucial for developers, network administrators, and cybersecurity professionals. Pinggy.io is a powerful platform that offers a comprehensive suite of tools, including a web debugger, to simplify the process of monitoring and analyzing network traffic. In this blog, we will explore how Pinggy.io’s traffic inspection capabilities, coupled with its user-friendly web debugger, can enhance your workflow and facilitate efficient debugging.
Understanding Traffic Inspection
Traffic inspection involves capturing and analyzing network packets to gain insights into the communication between various components within a system. It helps identify potential issues, monitor network performance, and diagnose problems effectively. By examining the traffic flow, developers and administrators can ensure optimal functionality, detect vulnerabilities, and improve overall system security.
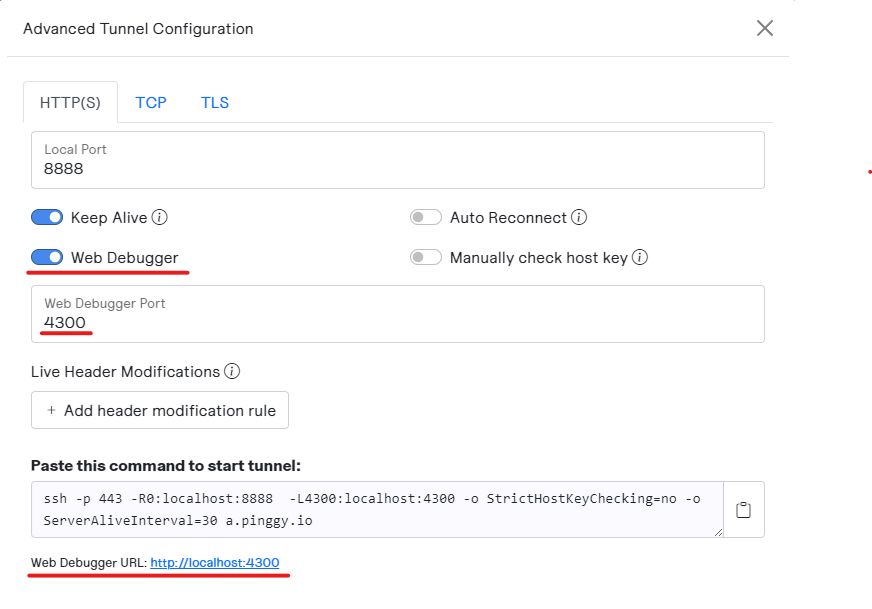
To get started, simply visit pinggy.io and initiate a tunnel with this command-
ssh -p 443 -R0:localhost:8888 -L4300:localhost:4300 -o StrictHostKeyChecking=no -o ServerAliveInterval=30 free.pinggy.ioOnce the tunnel is established, you can access the web debugger through the default URL: localhost:4300. Make sure the Web Debugger toggle is switched ON.
Try it yourself now
Streamlined Debugging with Pinggy.io
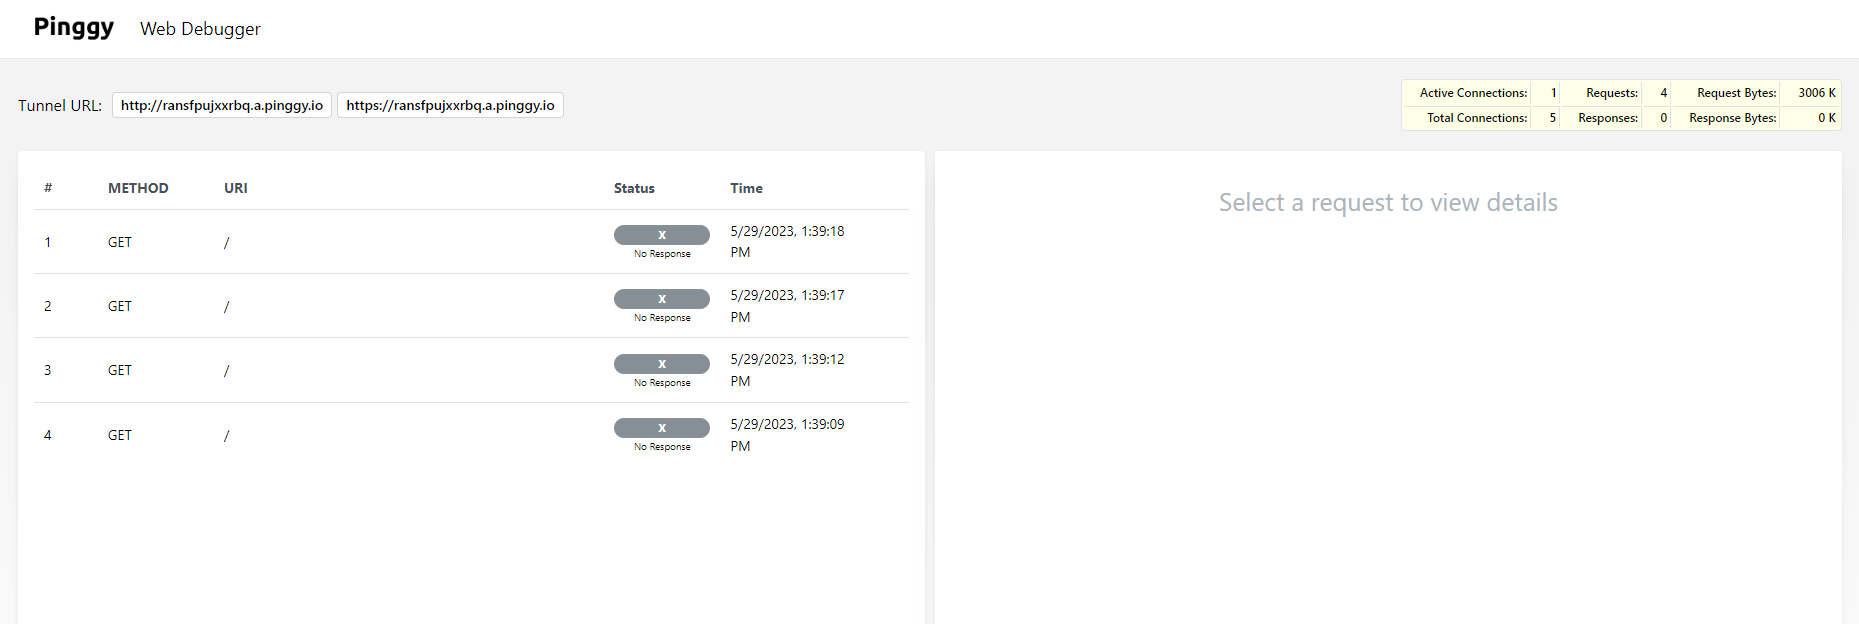
Capturing and Analyzing Traffic: Pinggy.io allows you to capture and examine traffic passing through your system in real-time. The web debugger provides a comprehensive overview of HTTP/HTTPS requests and responses, displaying crucial information such as headers, status codes, cookies, and more. This enables you to inspect the data being sent and received by your applications, making it easier to identify and resolve any issues.
Modifying and Testing Requests: The Pinggy.io web debugger empowers you to modify and replay requests, facilitating thorough testing and troubleshooting. You can customize headers, query parameters, and request bodies to simulate different scenarios and observe how your application responds. This capability is particularly useful for developers when validating API integrations or diagnosing errors.
Collaboration and Sharing: Pinggy.io facilitates collaboration by allowing you to share your debug sessions with teammates or stakeholders. This feature is invaluable for distributed teams or when seeking assistance from external experts. By sharing the debug session, others can view and analyze the traffic data, making it easier to diagnose complex issues collectively.
If you want to share the debug session just create a second Pinggy tunnel to the web debugger port which is
4300by default. Then share this URL with your teammates.
Conclusion
By leveraging Pinggy.io’s advanced features, you can streamline your debugging process, identify and resolve issues faster, and ensure the smooth functioning of your applications. Whether you are an experienced developer or a cybersecurity professional, Pinggy.io provides a user-friendly interface and robust functionality to meet your traffic inspection needs effectively.
So why not give Pinggy.io a try and experience its powerful traffic inspection capabilities for yourself? Visit pinggy.io, start a tunnel, and explore the seamless debugging experience offered by its web debugger. Your debugging process will never be the same again!