Web Debugger
Overview
The Web Debugger is a powerful feature provided by Pinggy to inspect HTTP requests and responses in real-time. It allows users to monitor, debug, and analyze tunnel traffic, including headers, payloads, and other request details. This is particularly useful for developers who need to troubleshoot web applications or APIs hosted on localhost.
Getting Started
To enable the Web Debugger, you need to configure a tunnel with the Web Debugger port specified. This feature is available for HTTP and HTTPS tunnels.
Start a Tunnel with Web Debugger:
Use the Pinggy CLI or SSH command to start a tunnel and specify the Web Debugger port (e.g., 4300). For example:
ssh -p 443 -R0:localhost:8080 -L4300:localhost:4300 a.pinggy.io
Here, -L4300:localhost:4300 specifies that the Web Debugger will be accessible on port 4300.
You can change it to some other port as follows:
-L9999:localhost:4300 specifies that the Web Debugger will be accessible on port 9999.
Access the Web Debugger:
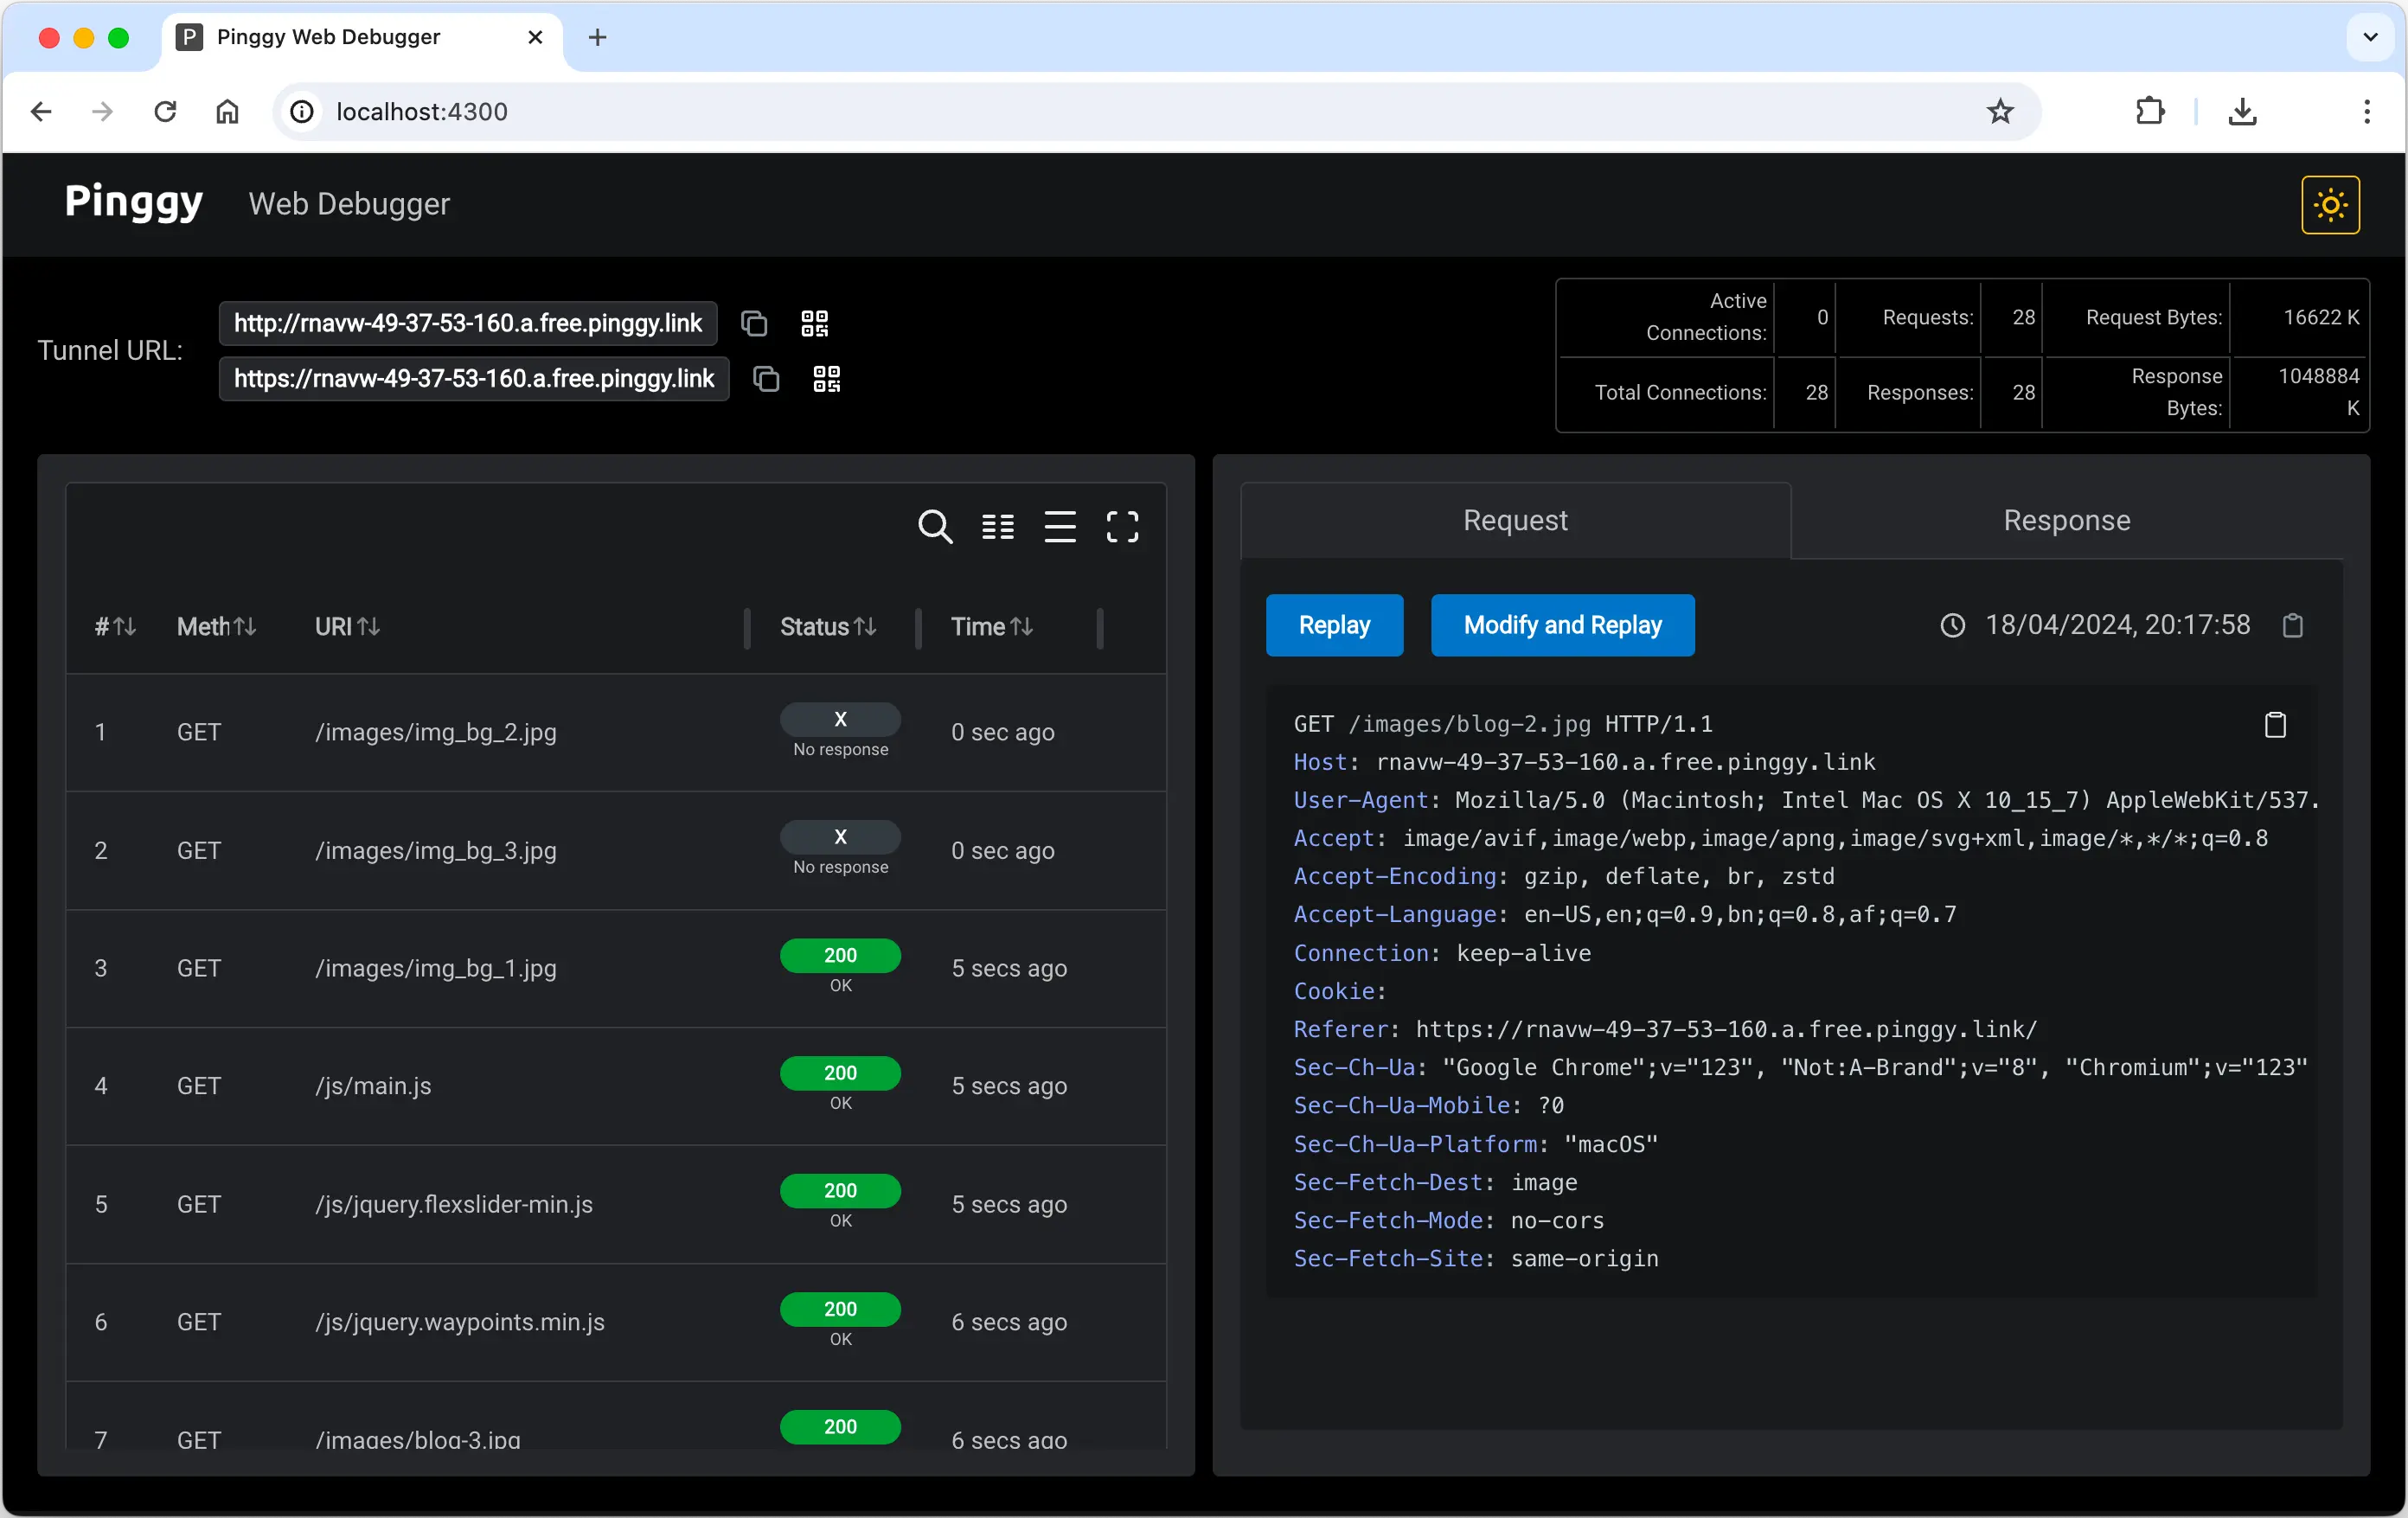
Open your browser and navigate to http://localhost:4300 to access the Web Debugger interface. You will see a dashboard displaying live request and response data.
Using the Pinggy CLI:
Alternatively, you can use the Pinggy CLI to start a tunnel with the Web Debugger enabled:
./pinggy -p 443 -R0:localhost:8080 -L4300:localhost:4300 a.pinggy.io
Programmatic Access with APIs:
Retrieve tunnel URLs and Web Debugger data programmatically by sending a GET request to http://localhost:4300/urls. Example response:
{
  "urls": [
    "http://rnckk-23.4.5.6.a.free.pinggy.link",
    "https://rnckk-23.4.5.6.a.free.pinggy.link"
  ]
}
Similarly, to get the list of whitelisted IP addresses, send a GET request to http://localhost:4300/ipwhitelist.
Get other tunnel settings from http://localhost:4300/ipwhitelist.
Features
After opening the web debugger (such as by visiting http://localhost:4300, you will be able to do the following:
- Live Request Inspection: View incoming HTTP requests, including headers, methods, and payloads.
- Response Monitoring: Inspect server responses, including status codes and response headers.
- Modification and replay: Modify HTTP requests including all headers, and replay the requests to debug your applications.
- Custom Port Configuration: Run the Web Debugger on a user-specified port for easy access.
- Zero Trust Mode: If you do not want Pinggy to read your data, then use
TLS tunnels. This will create end-to-end encrypted connections from the browser to your local HTTPS servers. Pinggy or any other actor cannot read your data, maintaining privacy.