Monitoring system metrics is essential for developers to ensure their applications run smoothly, optimize resource usage and quickly detect performance issues or bottlenecks.
In this article, we’ll look at how to remotely monitor your system’s performance metrics—specifically CPU, RAM, memory and disk usage—using FastAPI and Pinggy.
To accomplish this, we’ll use the
psutil library, which provides easy access to real-time system resource data.
To expose this data, we first need to start a server and FastAPI is an ideal choice for this purpose.
FastAPI is a modern, high-performance web framework for building APIs with Python, known for its speed and ease of setup.
Once the FastAPI server is set up, it will run locally on your machine.
However, since many systems are behind NAT (Network Address Translation) or CGNAT (Carrier-Grade NAT), remote access can be challenging.
To overcome this, we’ll use Pinggy to easily share the server to the internet.
Pinggy lets you expose your local FastAPI server to the internet with just a single command, even if your machine is behind a firewall, making it accessible remotely with minimal setup.
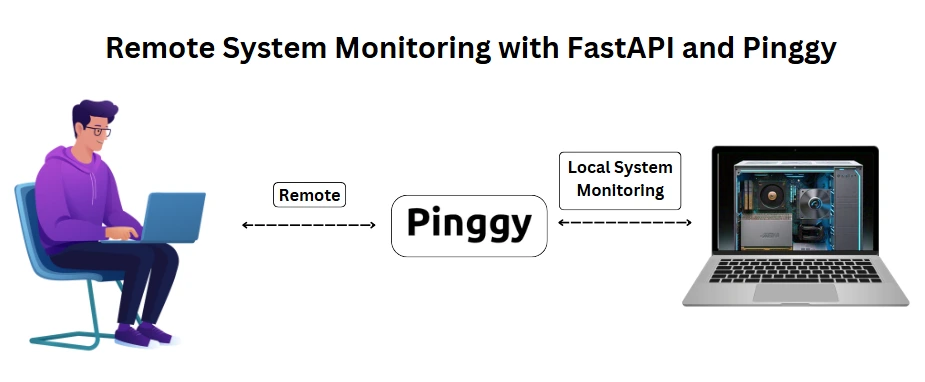
Now that we’ve covered the basics of this article, let’s move on to setting up a virtual environment and installing the necessary dependencies, including FastAPI and psutil, to start monitoring system performance metrics.
These steps will ensure that our development environment is ready for the project.
Setting Up the Environment and Installing Dependencies
Step 1: Create a Virtual Environment
When working on Python projects, it’s recommended to use a virtual environment to keep the packages for each project separate and isolated.
To create a virtual environment, you can use the venv module that comes with Python.
Note: If the command python does not work, try replacing it with python3
That command creates a new virtual environment in a directory called .venv.
Step 2: Activate the Virtual Environment
Now, activate the new virtual environment to ensure that any Python commands you execute or packages you install are applied within it.
To activate the virtual environment use the following commands:
For Linux, MacOS
source .venv/bin/activate
For Windows Powershell
.venv\Scripts\Activate.ps1
For Windows Bash
source .venv/Scripts/activate
Once activated, it’s a good idea to upgrade pip before installing packages like FastAPI, especially if you’re working in a fresh environment or haven’t updated pip in a while.
To upgrade pip, simply run:
python -m pip install --upgrade pip
Step 3: Install FastAPI
Now that you’ve created and activated your virtual environment, it’s time to install FastAPI so we can start building the system monitoring application.
To install FastAPI, along with some optional dependencies that will be helpful, use the following command:
pip install "fastapi[standard]"
This will install FastAPI along with additional dependencies such as uvicorn, which is needed to run the FastAPI server.
Step 4: Install psutil
After installing FastAPI, the next step is to install
psutil.
This Python library provides access to system utilization data, including CPU, memory, disk, and network usage, which is crucial for monitoring your system’s performance.
To install psutil, run the following command:
With the dependencies installed, it’s time to build the FastAPI application that will allow us to monitor system performance metrics.
Build the App to Monitor Your System Metrics
In this section, we will create routes for monitoring various system performance metrics, such as CPU usage, memory, and disk space. Each route will be explained separately to demonstrate how we can collect and display real-time system data using FastAPI.
Visit this GitHub Repository to access the codebase. (
GitHub Link )
Now, let’s discuss each component of the system individually.
Monitor CPU Usage Metrics
In this section, we will configure routes within our FastAPI application to monitor CPU usage on the system.
We’ll expose three routes to monitor various aspects of the CPU:
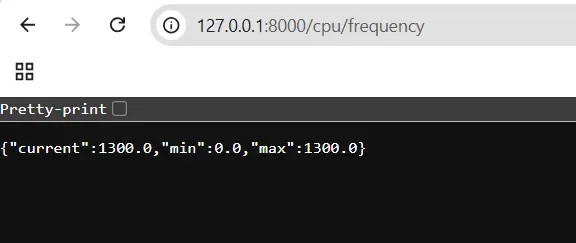
/cpu: Get the overall CPU usage percentage./cpu/cores: Get the CPU usage for each core individually./cpu/frequency: Retrieve information about the current, minimum, and maximum CPU frequencies.
Here’s the code to monitor CPU usage:
from fastapi import FastAPI
import psutil  # Assuming you are using psutil for CPU monitoring

app = FastAPI()

# Route to get CPU usage information
@app.get("/cpu")
async def get_cpu_usage():
    cpu_usage = psutil.cpu_percent(interval=1)  # Returns CPU usage as a percentage
    return {"cpu_usage": cpu_usage}

# Route to get CPU core information
@app.get("/cpu/cores")
async def get_cpu_cores():
    core_usage = psutil.cpu_percent(interval=1, percpu=True)  # Returns usage per core
    return {"core_usage": core_usage}

# Route to get CPU frequency information
@app.get("/cpu/frequency")
async def get_cpu_frequency():
    frequency = psutil.cpu_freq()  # Returns CPU frequency info
    return {
        "current": frequency.current,
        "min": frequency.min,
        "max": frequency.max
    }
The outputs of the different endpoints will be displayed as follows:
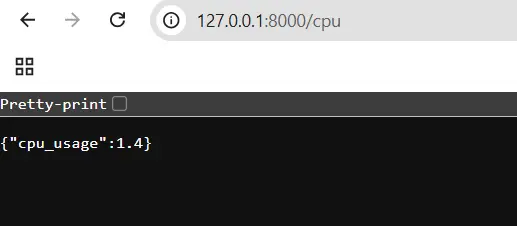
{ "core_usage": [50.2, 45.1, 40.5, 60.7] }
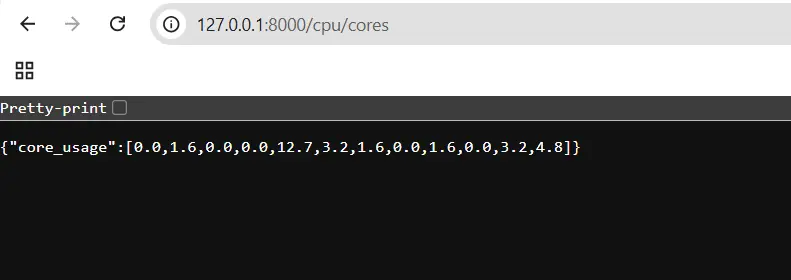
{ "current": 2200.0, "min": 1000.0, "max": 3500.0 }
Track Memory and Swap Usage
In this section, we will create routes to monitor memory usage, which is important for understanding how much memory is being used and how much is available.
We’ll track both virtual memory and swap memory.
Virtual memory represents the system’s total memory, while swap memory refers to disk-based memory used when physical memory is full.
We’ll expose two routes:
/memory: Get the current status of virtual memory./memory/swap: Retrieve swap memory usage statistics.
Here’s the code to monitor memory and swap usage metrics:
from fastapi import FastAPI
import psutil

app = FastAPI()

@app.get("/memory")
async def get_memory_usage():
    """Returns virtual memory usage metrics."""
    memory = psutil.virtual_memory()
    return {
        "total": memory.total,
        "available": memory.available,
        "used": memory.used,
        "percent": memory.percent
    }

@app.get("/memory/swap")
async def get_swap_memory_usage():
    """Returns swap memory usage metrics."""
    swap = psutil.swap_memory()
    return {
        "total": swap.total,
        "used": swap.used,
        "free": swap.free,
        "percent": swap.percent,
        "sin": swap.sin,
        "sout": swap.sout
    }
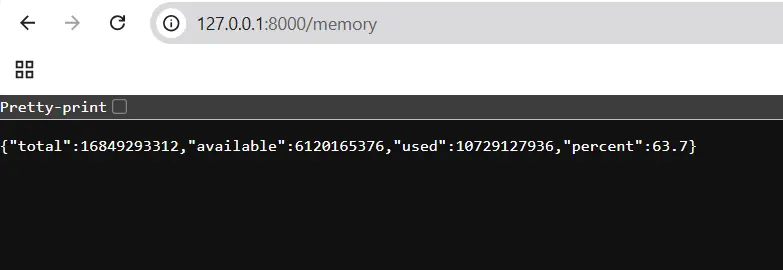
After executing the code, the responses from each endpoint will look like this:
{
  "total": 16777216000,
  "available": 8225292288,
  "used": 7374233600,
  "percent": 57.3
}
{
  "total": 8589934592,
  "used": 1073741824,
  "free": 7516192768,
  "percent": 12.5,
  "sin": 0,
  "sout": 0
}

Monitor RAM Utilization
In this section, we’ll focus on monitoring RAM usage as a percentage, which helps in understanding the system’s memory health and efficiency.
To achieve this, we’ll create a route that provides the RAM usage:
/ram: Returns RAM usage in percentage.
Here’s the code to track RAM utilization:
from fastapi import FastAPI
import psutil

app = FastAPI()

@app.get("/ram")
async def get_ram_usage():
    """Returns RAM usage in percentage."""
    return {"ram_usage": psutil.virtual_memory().percent}

# To run this application, use the following command:
# uvicorn <filename_without_py_extension>:app --reload
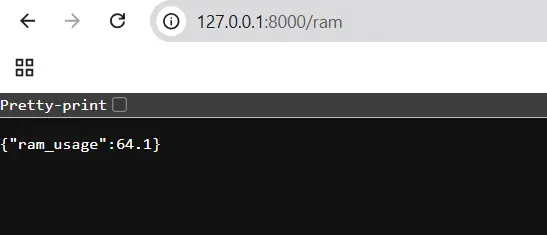
After executing the above code, the response from the endpoint will look like this:
Disk Usage and I/O Statistics
Monitoring disk usage is essential for understanding how much storage space is being utilized on the system.
This includes tracking overall disk usage, checking mounted partitions, and displaying disk I/O statistics (read/write operations).
To accomplish this, we’ll expose three routes:
/disk: Returns overall disk usage for the root filesystem./disk/partitions: Provides information about mounted disk partitions./disk/io: Displays disk I/O statistics.
Here’s the code to monitor disk usage and I/O statistics:
from fastapi import FastAPI
import psutil

app = FastAPI()

@app.get("/disk")
async def get_disk_usage():
    """Returns disk usage metrics for the root filesystem."""
    disk = psutil.disk_usage('/')
    return {
        "total": disk.total,
        "used": disk.used,
        "free": disk.free,
        "percent": disk.percent
    }

@app.get("/disk/partitions")
async def get_disk_partitions():
    """Returns information about mounted disk partitions."""
    partitions = psutil.disk_partitions()
    partition_info = []
    for partition in partitions:
        partition_info.append({
            "device": partition.device,
            "mountpoint": partition.mountpoint,
            "fstype": partition.fstype,
            "opts": partition.opts
        })
    return {"partitions": partition_info}

@app.get("/disk/io")
async def get_disk_io():
    """Returns disk I/O statistics."""
    io_stats = psutil.disk_io_counters()
    return {
        "read_count": io_stats.read_count,
        "write_count": io_stats.write_count,
        "read_bytes": io_stats.read_bytes,
        "write_bytes": io_stats.write_bytes,
        "read_time": io_stats.read_time,
        "write_time": io_stats.write_time
    }
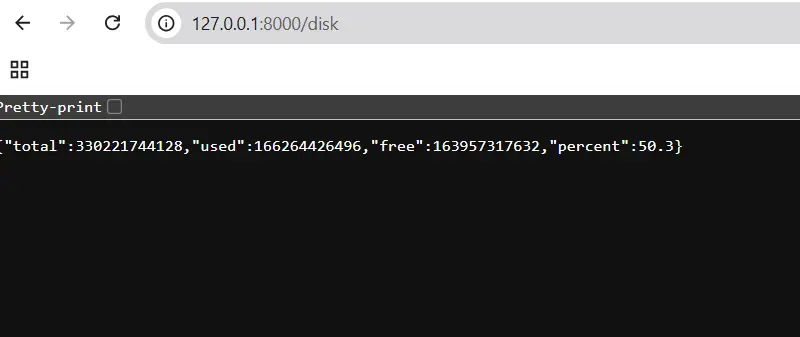
The responses from each endpoint will look like this:
{
  "total": 500107862016,
  "used": 237081992192,
  "free": 263025547776,
  "percent": 47.5
}
{
  "partitions": [
    {
      "device": "/dev/sda1",
      "mountpoint": "/",
      "fstype": "ext4",
      "opts": "rw,relatime"
    }
  ]
}

{
  "read_count": 1000000,
  "write_count": 500000,
  "read_bytes": 1048576000,
  "write_bytes": 524288000,
  "read_time": 5000,
  "write_time": 2000
}

Run the FastAPI Application locally
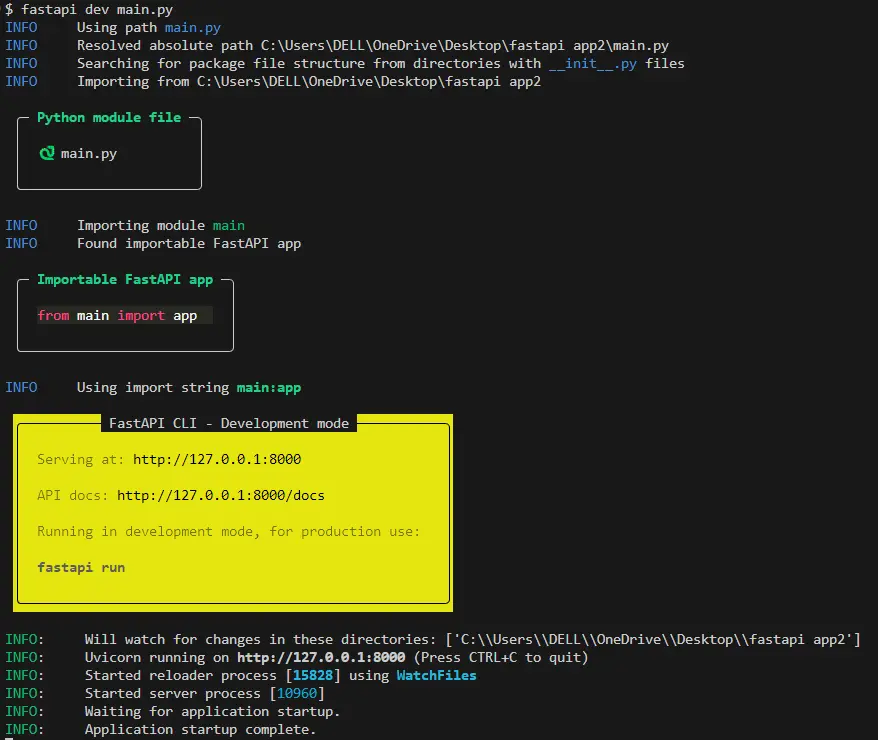
Once you’ve set up the application and configured all the necessary routes, you can run the FastAPI application locally.
To do so, simply use the following command:
This command will start the FastAPI server and make your endpoints available for testing and monitoring system metrics.
Check the output
To view the results, open your browser and navigate to the following URL:
http://127.0.0.1:8000/<required-endpoint>
Each endpoint will return a JSON response with the requested system metrics.
Simply replace <required-endpoint> with the specific route you want to test, such as /cpu, /memory or /disk and you’ll see the corresponding real-time system usage data.
Remotely Access Your FastAPI App Using Pinggy
Pinggy provides a simple and secure method to make your local FastAPI application accessible on the internet, even if your system is behind NAT or CGNAT.
This eliminates the need for complex server configurations or cloud services.
Use the following SSH command to set up a tunnel to your local development server:
ssh -p 443 -R0:localhost:8000 qr@a.pinggy.io
Note: Replace the port 8000 in the command with the port where your local development server is running.
After running the command, Pinggy will generate a public URL which might looks like this:
http://rnnex-2405-201-800b-489d-7063-516b-6c80-5d24.a.free.pinggy.link
Add the endpoint after this link to get the required output.
Say for getting cpu uage informtion, the link would be like
http://rnnex-2405-201-800b-489d-7063-516b-6c80-5d24.a.free.pinggy.link/cpu

When you paste the modified URL into your browser, your FastAPI application will process the request and return the output in JSON format, which will be displayed directly in the browser.
Output would look like:-

Benefits of Using Pinggy to Expose Your FastAPI Application
Pinggy offers several key advantages for developers:
- Easy Setup: Quickly make your local FastAPI app accessible on the internet without needing cloud setups or server deployments.
- Streamlined Testing and Demos: Perfect for sharing your application during development or running live demos, especially for integrations with external services that require public URLs (e.g., webhooks, payment systems).
- Remote Access: With Pinggy’s public URL, anyone can access your app, even if they are not on the same network as you.
- Built-in Security: Pinggy automatically supports HTTPS, ensuring secure connections between your local app and external clients.
- Developer-Friendly Experience: Pinggy is easy to use and doesn’t require complex configurations, making it ideal for developers of all skill levels.
Conclusion
This guide demonstrated how to monitor system performance metrics remotely using FastAPI and Pinggy.
By utilizing the psutil library, we efficiently gather real-time data on CPU, memory, RAM, and disk usage.
The core of this solution lies in Pinggy, which enables secure tunneling of a local FastAPI server to the internet, making it accessible remotely, even if the local system is behind network restrictions like NAT or CGNAT.
This approach simplifies system monitoring, providing continuous access to vital performance metrics from anywhere.
With this setup, you can quickly diagnose issues, optimize resource usage, and ensure better overall system health.