Ever found yourself staring at a terminal, waiting for that one error message to appear so you can finally figure out what’s breaking your service? Yeah, we’ve all been there. If you’re working with modern Linux systems running systemd, journalctl -f is about to become your best friend for real-time log monitoring.
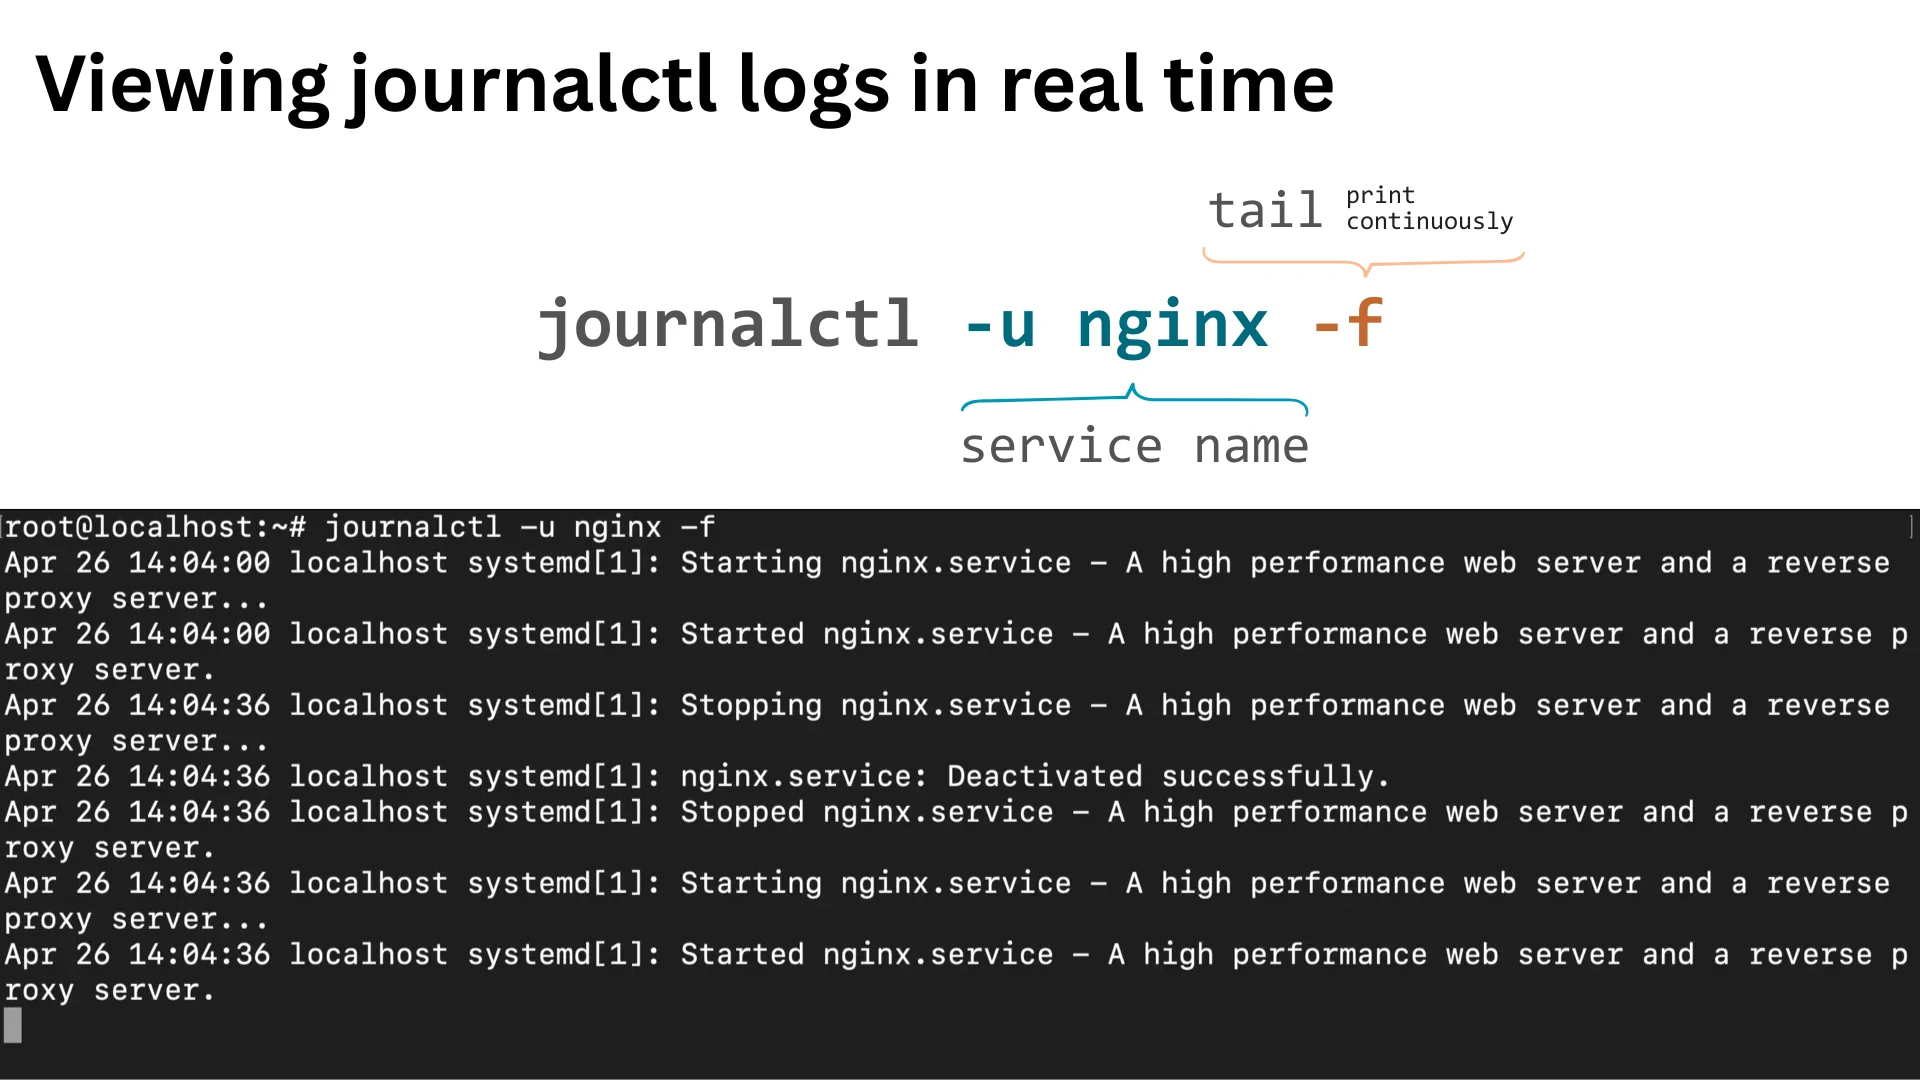
Think of it like tail -f but supercharged with systemd’s journal capabilities. Instead of just watching a single log file, you get access to all your system logs with powerful filtering built right in. You can watch logs as they happen, filter by service, priority level, or time range, and actually make sense of what your system is doing in real-time.
# Basic live log monitoring
journalctl -f

# Live monitoring of specific service
journalctl -u service_name -f

# Example: Monitor the journal daemon itself
journalctl -u systemd-journald.service -f

# Live monitoring with error level filtering
journalctl -f -p err
Summary
Basic Real-Time Monitoring
# Stream logs as they're generated
journalctl -f
# Monitor specific service
journalctl -u nginx.service -f
Filtering Options
# Show only errors
journalctl -f -p err
# Filter by time
journalctl --since="1 hour ago" -f
# Limit initial output before streaming
journalctl -n 20 -f
Advanced Filtering and Highlighting
# Highlight errors in stream
journalctl -f | grep --color "error"
# Monitor multiple services
journalctl -u nginx -u mysql -f
# Format as JSON for processing
journalctl -f -o json
Dashboard Integration
Streaming Live Logs with journalctl -f and Filtering by Service (-u)
Let’s start with the basics. When you run journalctl -f, you’re telling systemd to show you logs as they happen—like watching a live feed of everything your system is doing.
Basic Real-Time Monitoring
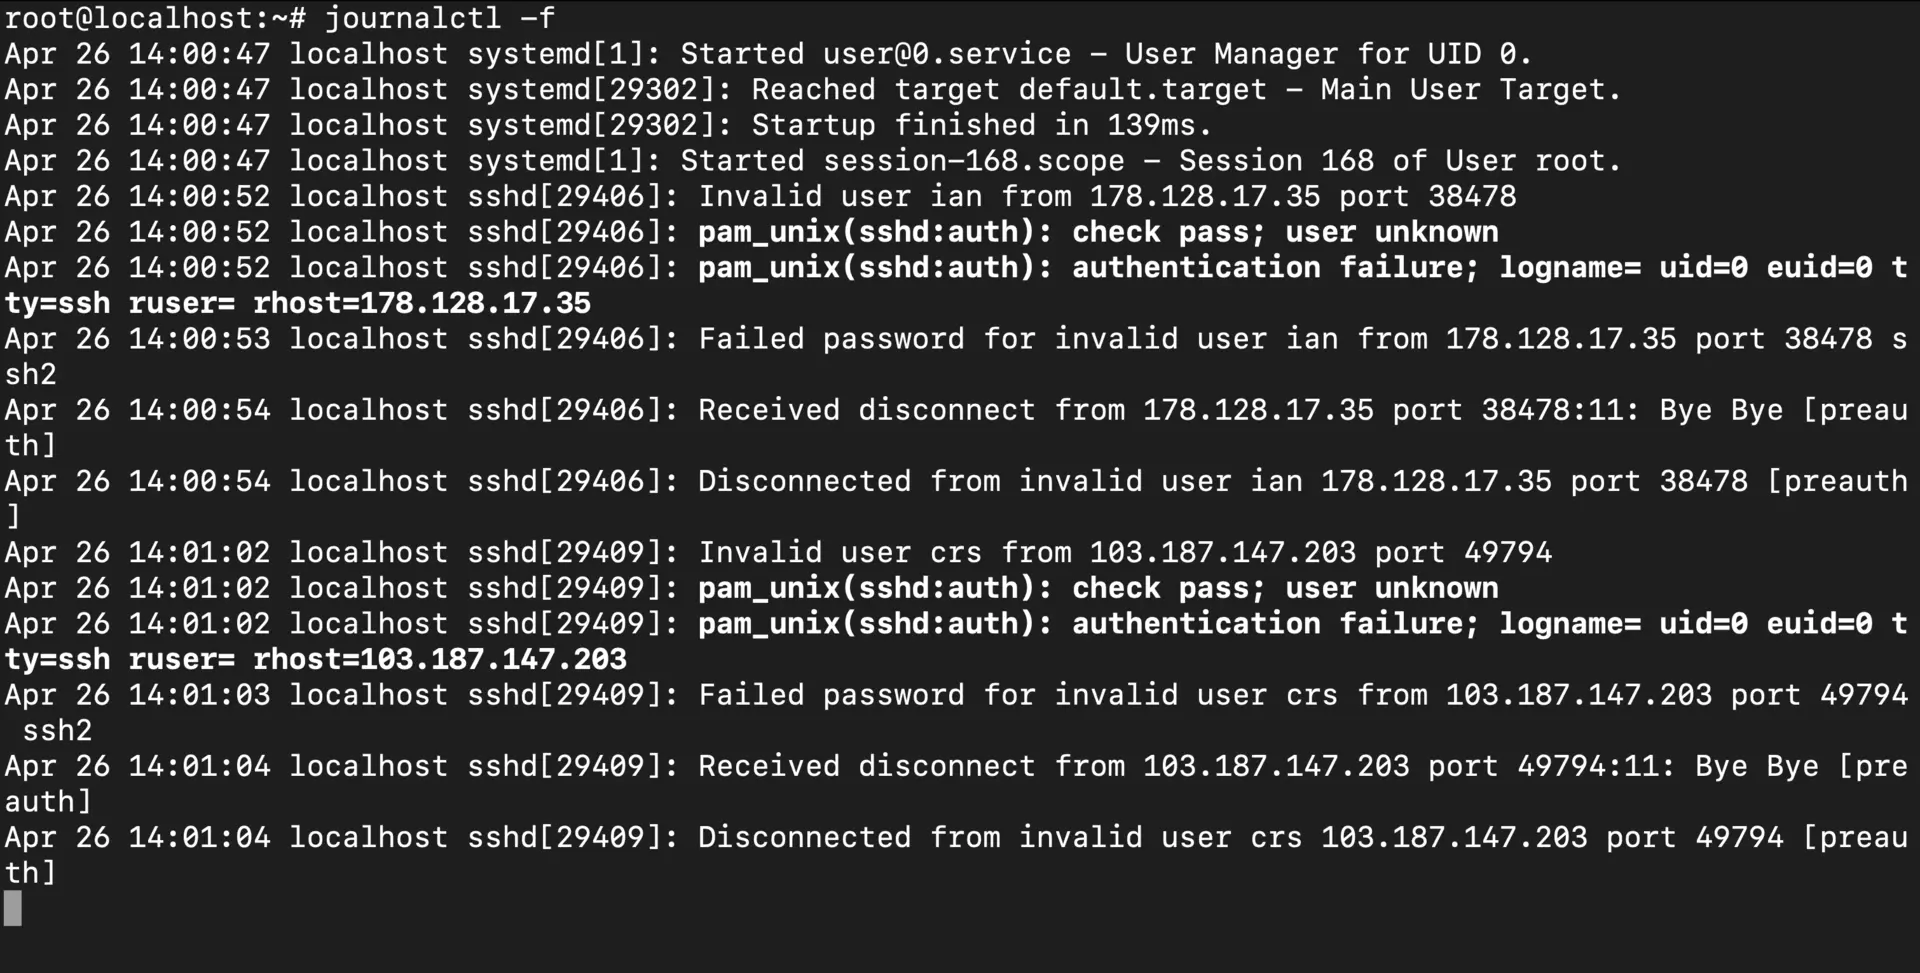
This streams new journal entries continuously until you hit Ctrl+C to stop it. You’ll see everything—kernel messages, service logs, authentication attempts, the works. It’s particularly handy when you’re:
- Restarting a service and want to catch any startup errors immediately
- Running system updates and watching for issues
- Debugging those annoying intermittent problems that only show up occasionally
- Monitoring what happens when you trigger a specific action
Filtering by Service
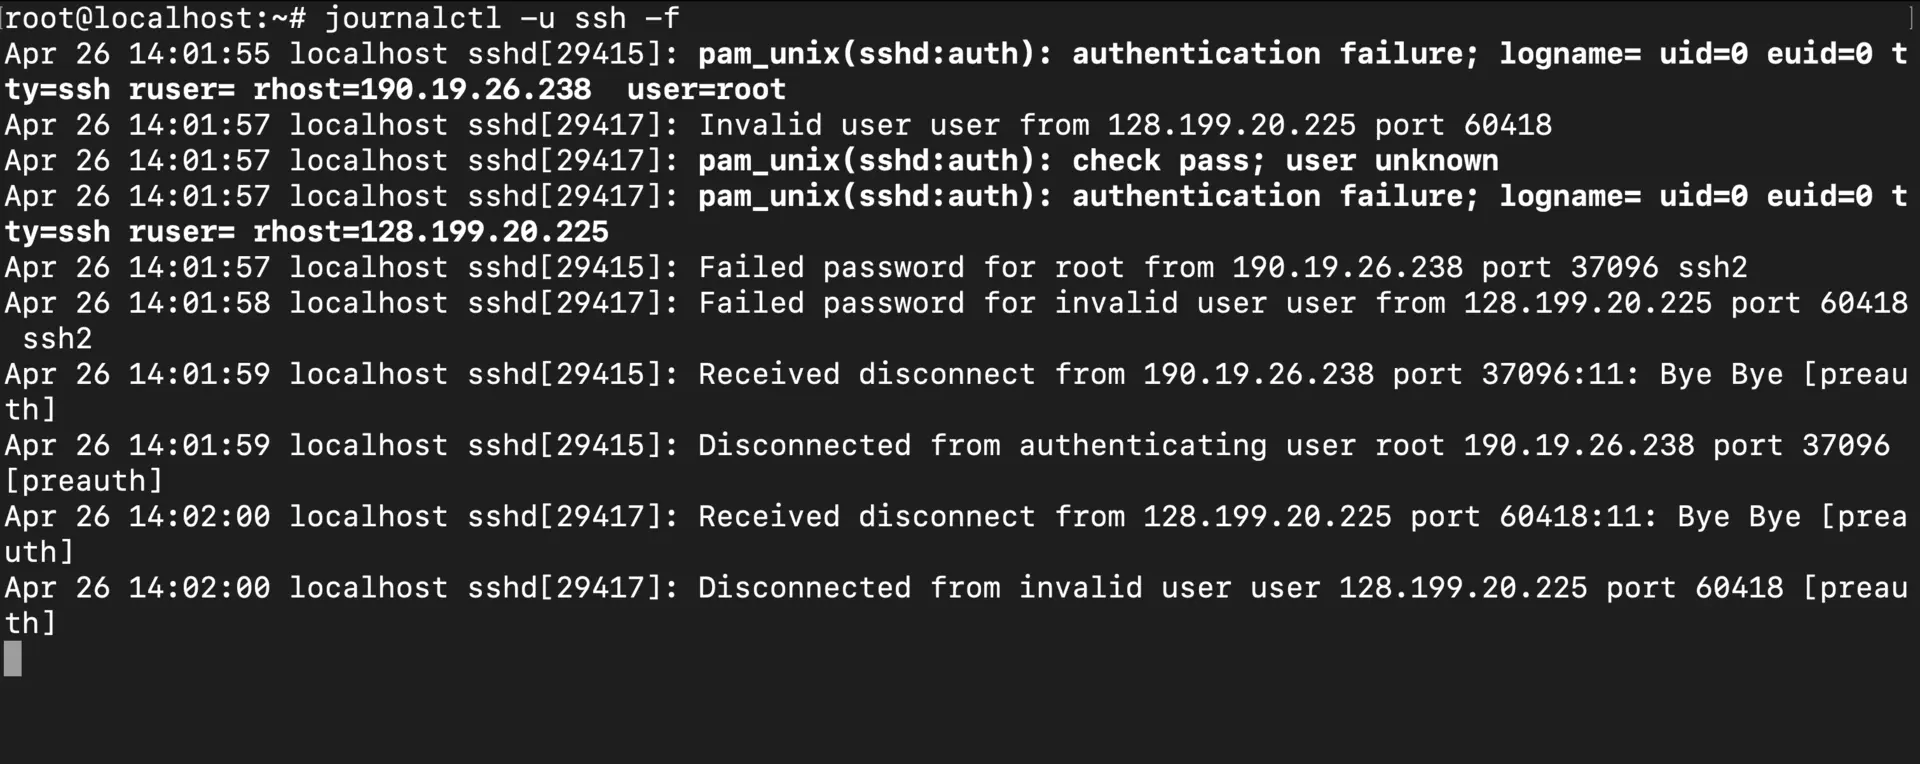
Now, watching everything can get overwhelming fast. That’s where the -u flag comes in—it lets you focus on just one service:
# Monitor the SSH service in real-time
journalctl -u ssh -f
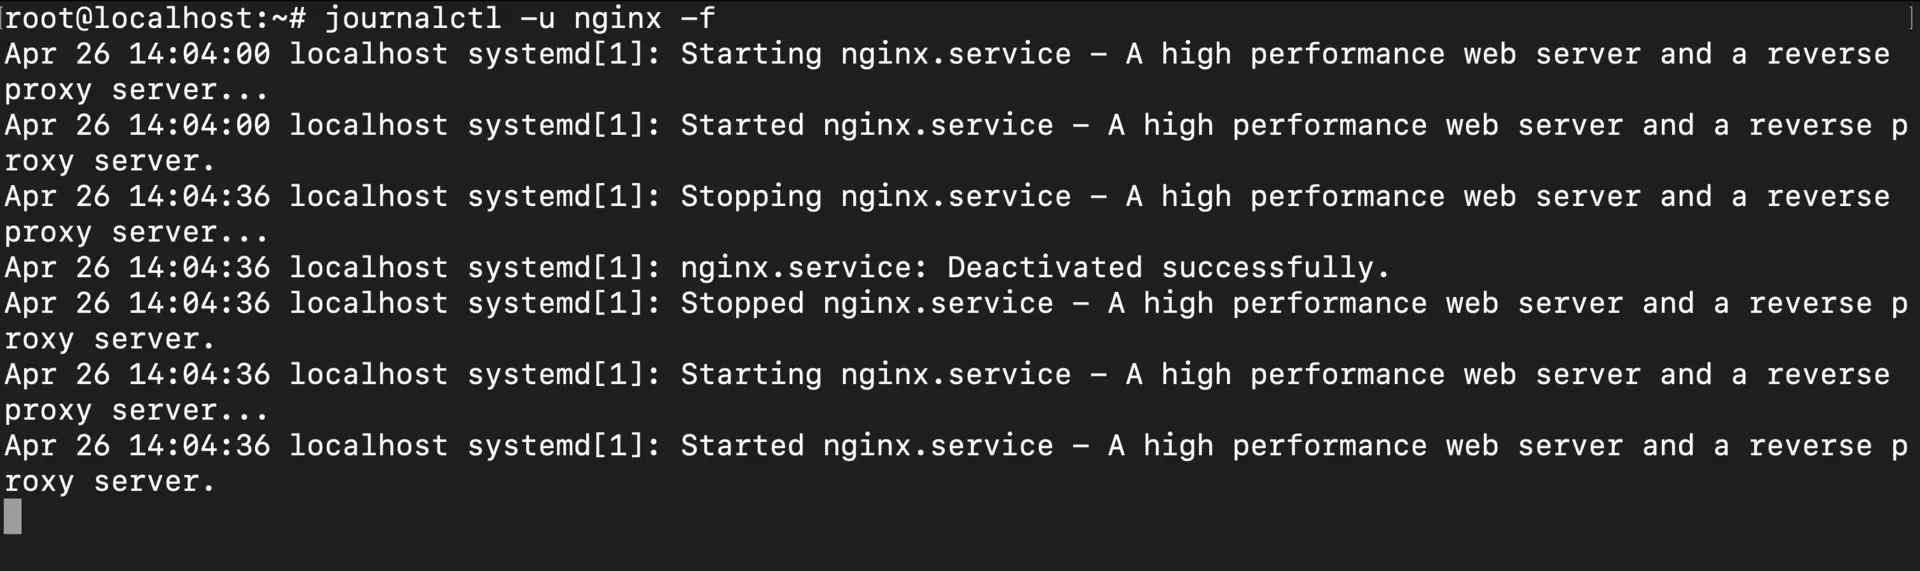
# Monitor the Nginx web server in real-time
journalctl -u nginx -f
# Monitor a custom service
journalctl -u my-application.service -f
This is a game-changer when you’re:
- Deploying a new config and want to see if the service picks it up correctly
- Debugging why a specific service keeps crashing
- Watching how your application behaves under load
- Monitoring for failed SSH login attempts or suspicious activity
Practical Example: Monitoring a Service During Restart
Here’s a real-world scenario: you’ve just updated your nginx config and need to restart the service. Instead of restarting blindly and hoping for the best, open two terminals:
# In terminal 1: Watch the service logs in real-time
journalctl -u nginx -f

# In terminal 2: Restart the service
sudo systemctl restart nginx
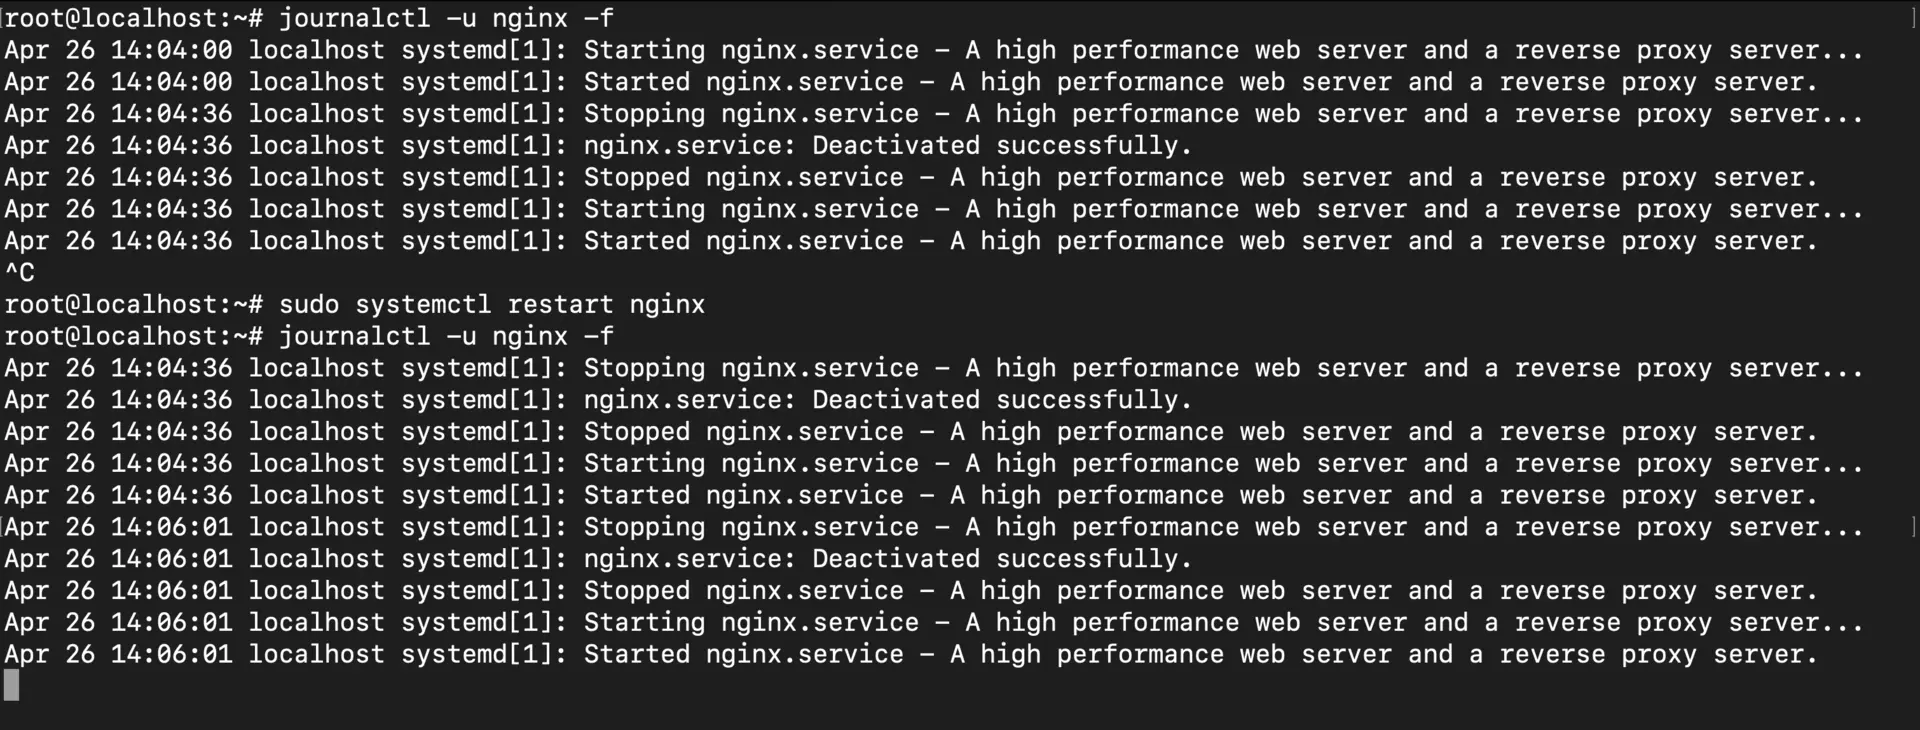
In terminal 1, you’ll see exactly what happens during the restart—whether nginx reloads cleanly, if there are any config syntax errors, or if it fails to bind to a port. No more guessing, no more checking systemctl status after the fact and wondering what went wrong.
Basic Log Viewing: Filtering by Time (--since) and Limiting Output (-n)
Sometimes you don’t need to see everything from the beginning of time—you just want logs from the last hour or since you deployed that change this morning. That’s where time filtering becomes incredibly useful.
Time-Based Filtering
# Show logs since boot and continue monitoring
journalctl --since=today -f

# Show logs since a specific time and continue monitoring
journalctl --since="2025-04-22 09:00:00" -f

# Show logs from the last hour and continue monitoring
journalctl --since="1 hour ago" -f
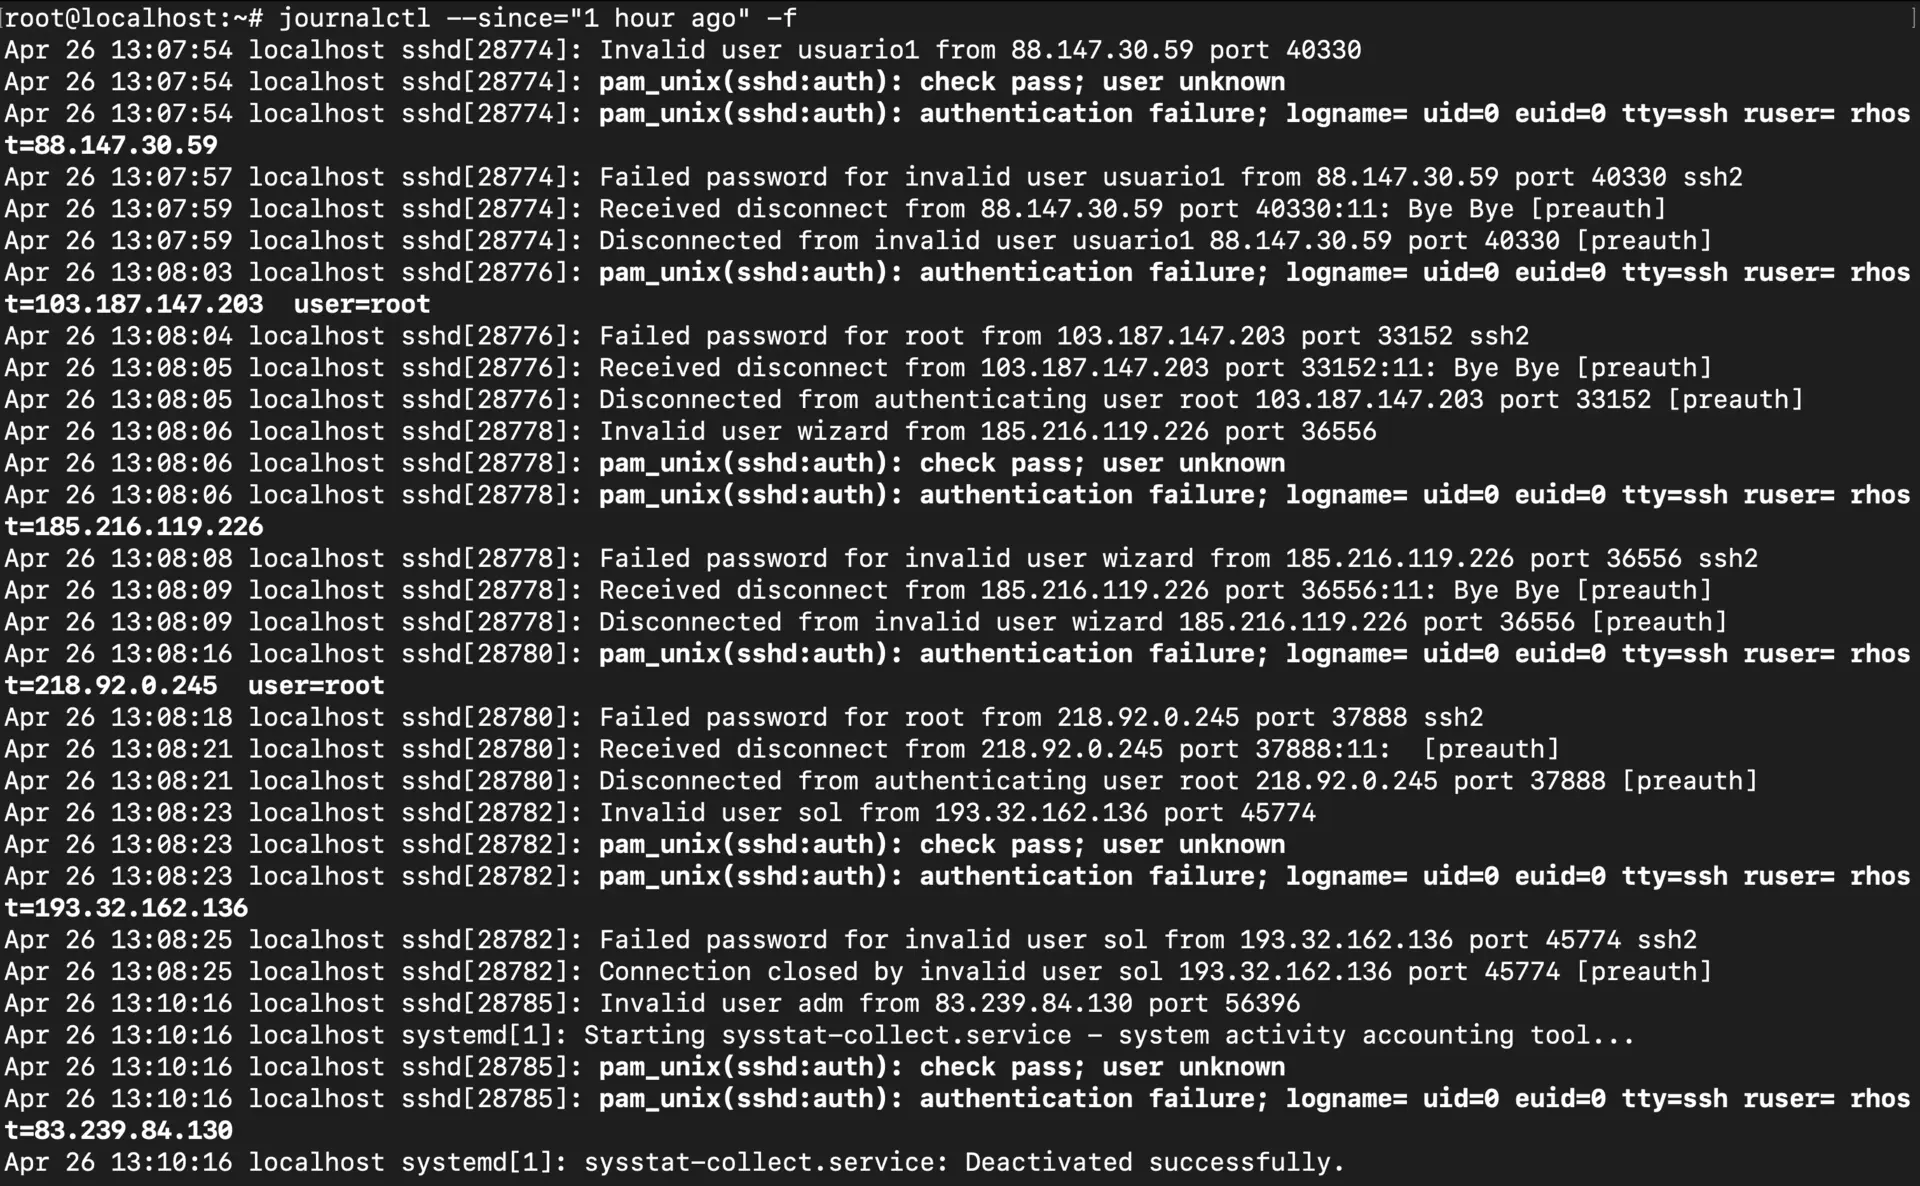
The --since parameter is pretty flexible. You can use natural language like “yesterday” or “2 days ago”, or be precise with absolute timestamps. This is super helpful when you know roughly when a problem started and don’t want to wade through days of logs.
Limiting Initial Output
Here’s a neat trick: when you start monitoring with -f, journalctl shows you the last 10 lines by default before switching to live mode. But you can control this:
# Show the last 20 lines before starting real-time monitoring
journalctl -n 20 -f

# Show no past entries, only new ones (equivalent to --lines=0 -f)
journalctl --no-tail -f
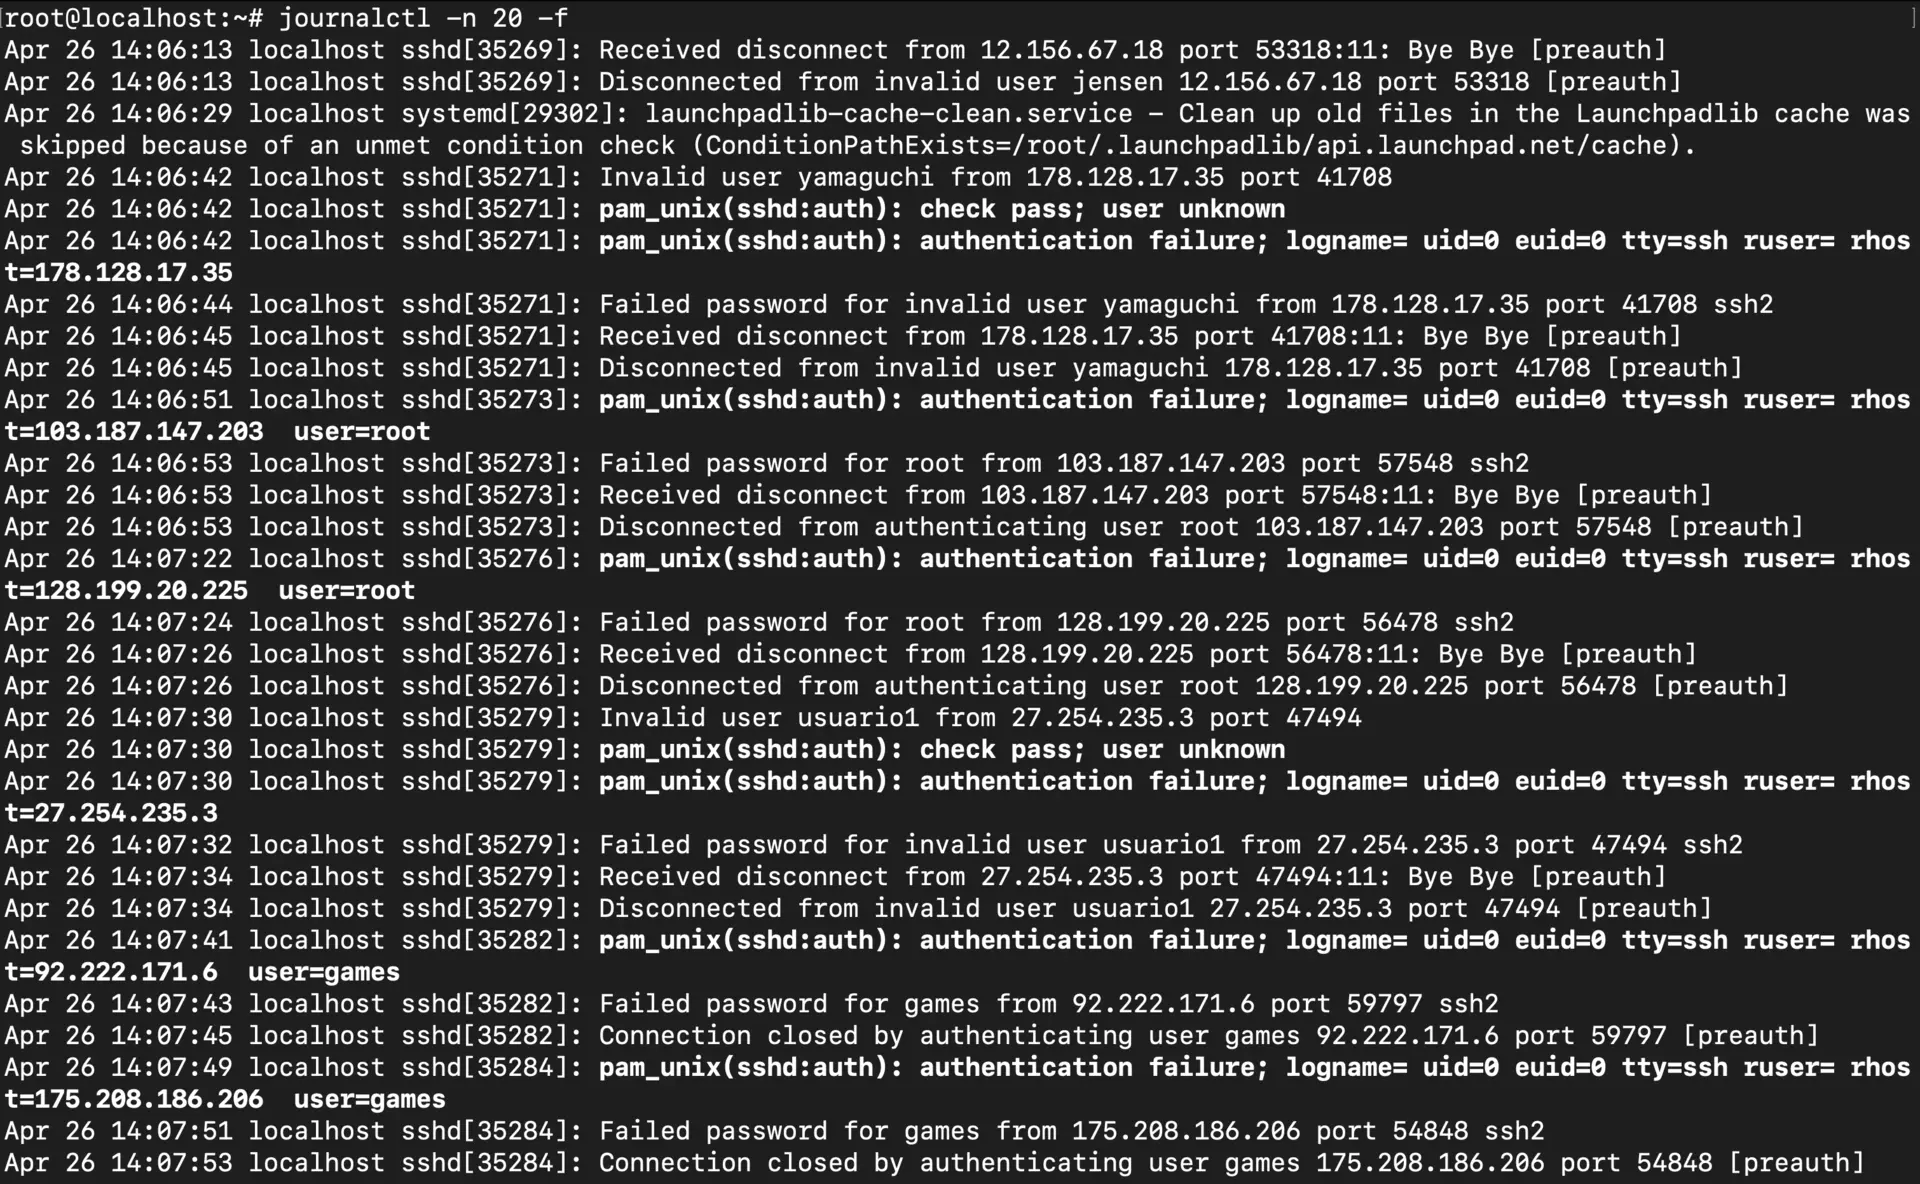
The -n 20 gives you a bit of context before the live stream starts, while --no-tail is perfect when you only care about what happens after you start watching.
Combining Time Filters with Service Filters
Now here’s where it gets really powerful—you can stack these filters together:
# Show nginx logs since the last boot and continue monitoring
journalctl -u nginx --since=boot -f

# Show SSH logs from the past 30 minutes and continue monitoring
journalctl -u ssh --since="30 min ago" -f
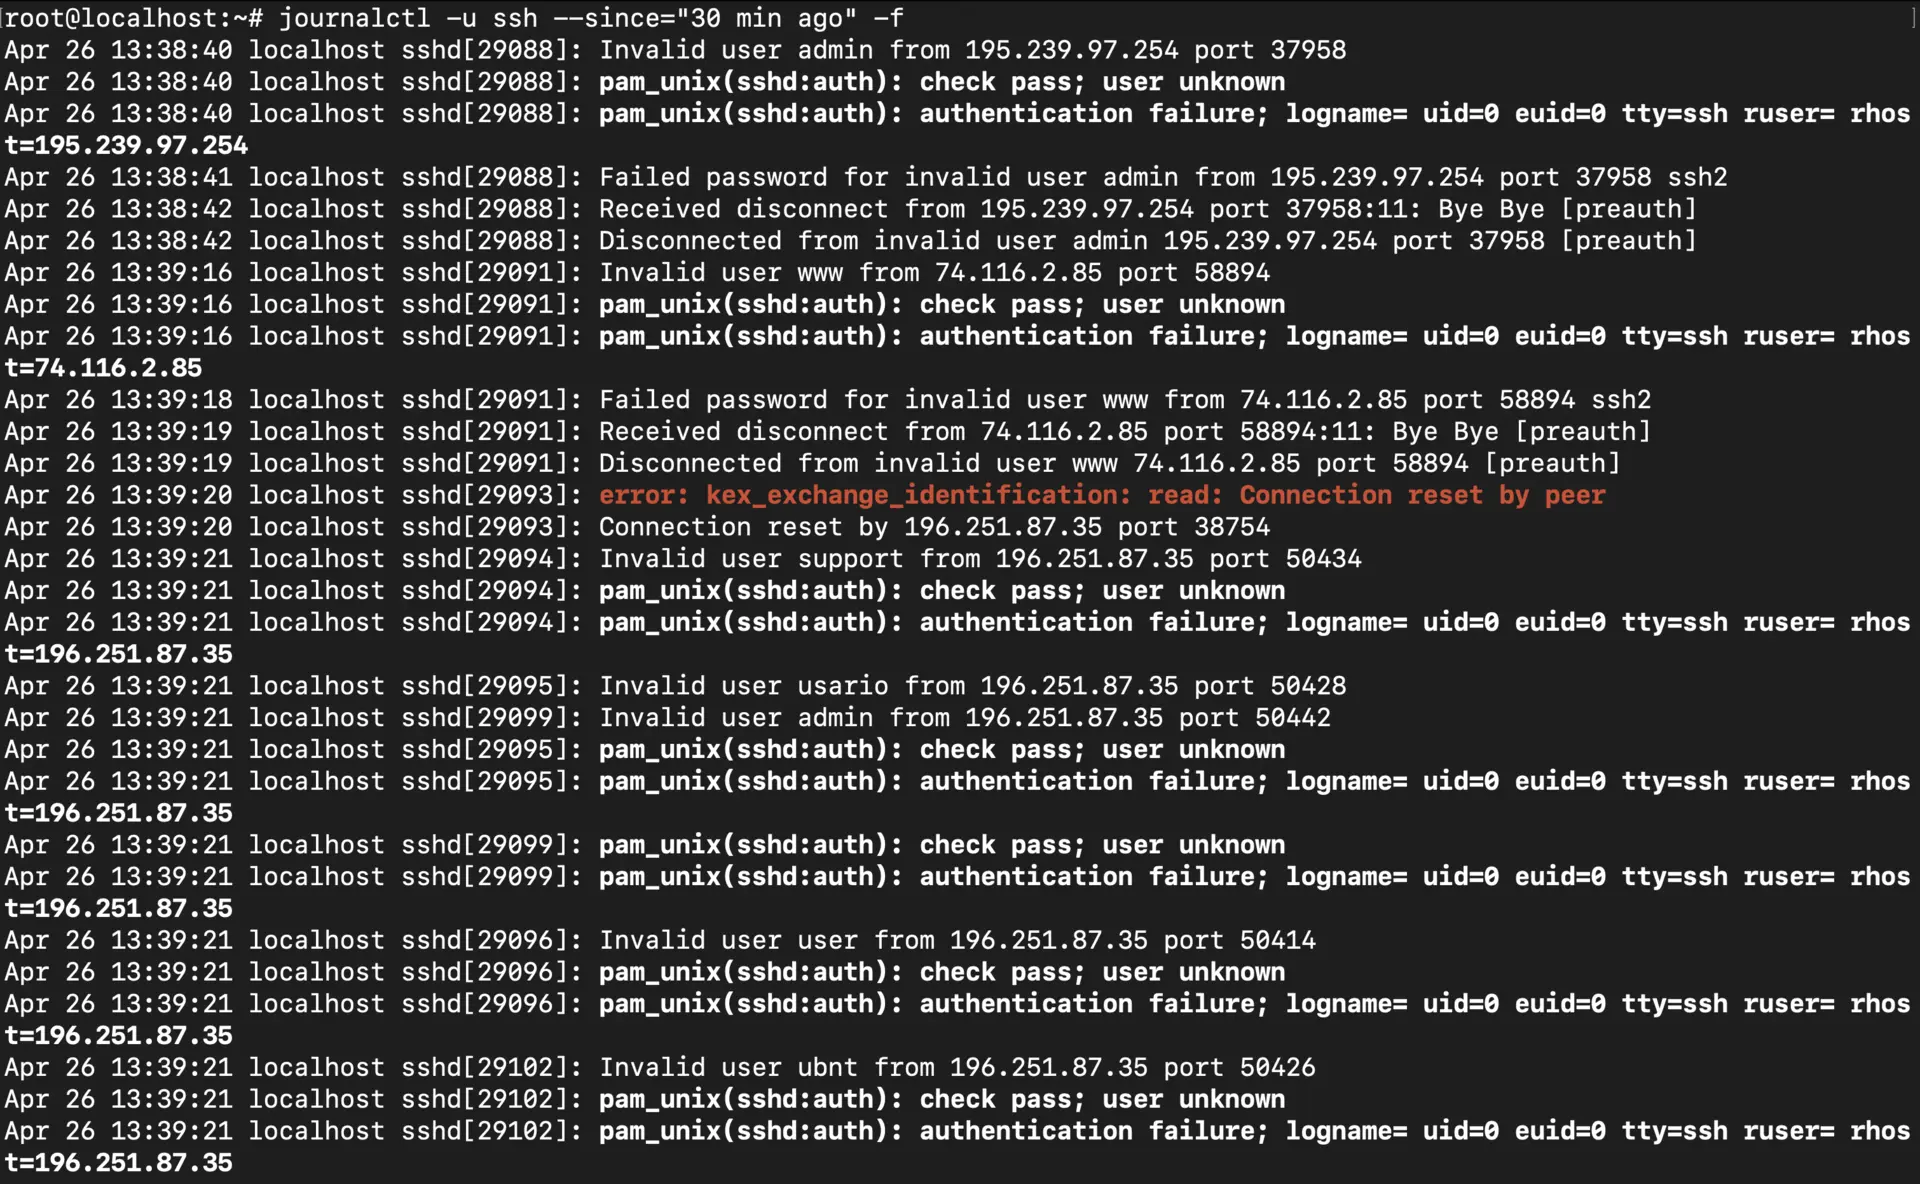
This is perfect for scenarios like “show me all nginx logs since the server rebooted” or “let me see what SSH activity happened in the last half hour and keep watching.” You get the context you need without drowning in irrelevant logs.
Efficient Log Searching and Highlighting with grep
Journalctl is great, but sometimes you need to find specific patterns in the log stream. That’s where piping to grep becomes your secret weapon. You get pattern matching and visual highlighting, making errors jump out at you.
Basic Pattern Matching
# Highlight error messages in real-time logs
journalctl -f | grep --color "error"

# Highlight multiple patterns
journalctl -f | grep --color -E "error|warning|critical"
The --color flag makes matching text stand out in your terminal. When you’re watching a fast-moving log stream, this visual cue is invaluable.
Case-Insensitive Searching
# Match "error", "ERROR", "Error", etc.
journalctl -f | grep --color -i "error"
Because let’s be honest, not all applications log consistently. Some scream “ERROR”, others whisper “error”, and some go with “Error”. The -i flag catches them all.
Context Lines
Sometimes you need to see what happened right before or after an error:
# Show 2 lines before and after each match
journalctl -f | grep --color -A 2 -B 2 "failed"
The -A (after) and -B (before) flags give you context. This is super helpful when an error message alone doesn’t tell the whole story.
Inverting the Match
Sometimes it’s useful to exclude certain noisy log entries:
# Show all logs except those containing "periodic"
journalctl -f | grep --color -v "periodic"
The -v flag inverts the match, showing everything except what you specify. Great for reducing noise.
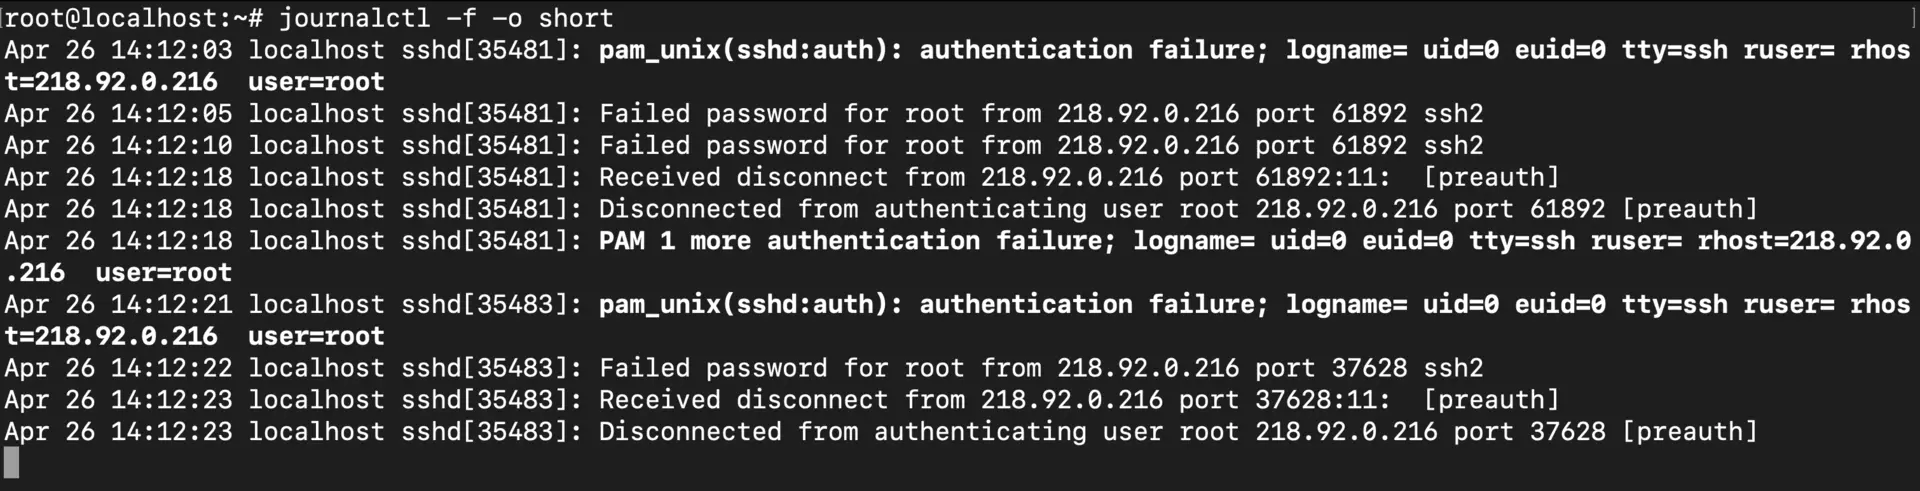
Practical Example: Monitoring Authentication Failures
# Monitor for failed login attempts in real-time
journalctl -f | grep --color -E "Failed password|authentication failure|invalid user"
This is one of those commands you’ll want to keep handy. It watches for various authentication failure patterns across all services—perfect for security monitoring or debugging login issues.
Monitoring Multiple Services Simultaneously
Real-world applications rarely run in isolation. Your web app might depend on nginx, a database, a cache, and a background worker. When something breaks, you need to see how all these pieces interact.
Using Multiple -u Options
# Monitor both web server and database logs simultaneously
journalctl -u nginx -u mysql -f
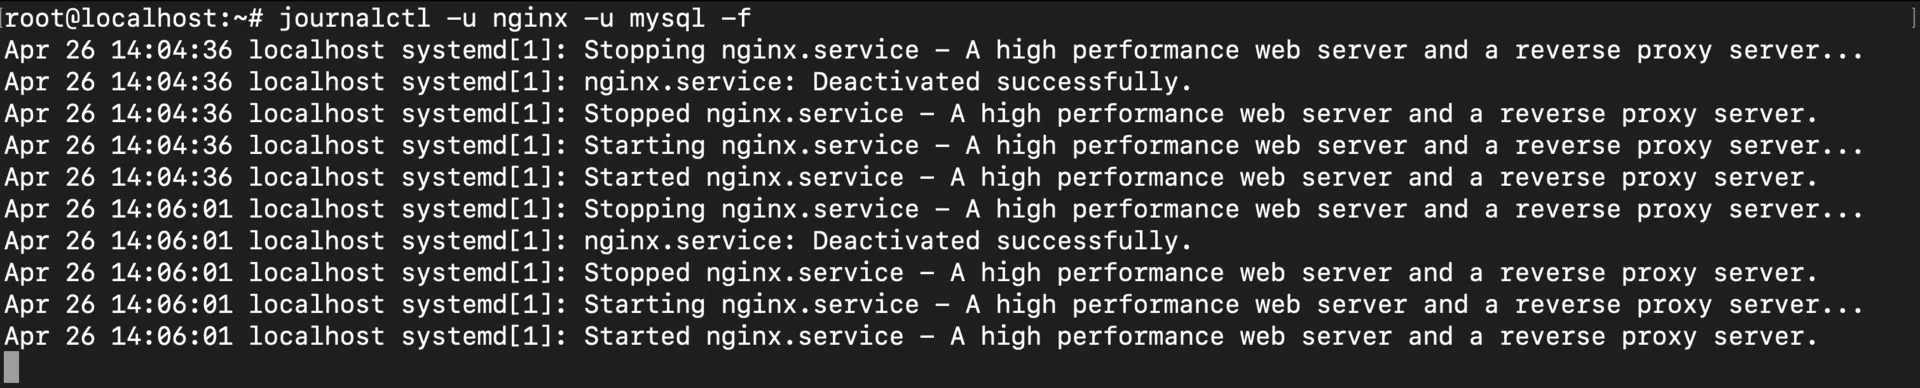
This merges logs from both services into a single chronological stream. So when you see nginx throwing 502 errors, you can immediately check if mysql is having connection issues at the exact same time. The cause-and-effect relationship becomes obvious.
Monitoring Service Groups
Sometimes you want to watch all services that match a pattern:
# Monitor all Apache-related services
journalctl -f _SYSTEMD_UNIT=apache*

# Monitor all container services
journalctl -f _SYSTEMD_UNIT=*container*
This is handy when you have multiple related services (like apache2 and apache2-utils) and want to see them all at once.
Monitoring Service Dependencies
For complex troubleshooting, you might need to watch a service along with everything it depends on:
# First, identify dependencies
systemctl list-dependencies my-service

# Then monitor both the service and its critical dependencies
journalctl -u my-service -u dependent-service1 -u dependent-service2 -f
This gives you the full picture. If your service fails to start, you’ll see whether it’s because a dependency didn’t come up properly.
Practical Example: Web Application Stack Monitoring
# Monitor the entire web application stack in real-time
journalctl -u nginx -u php-fpm -u redis -u postgres -f
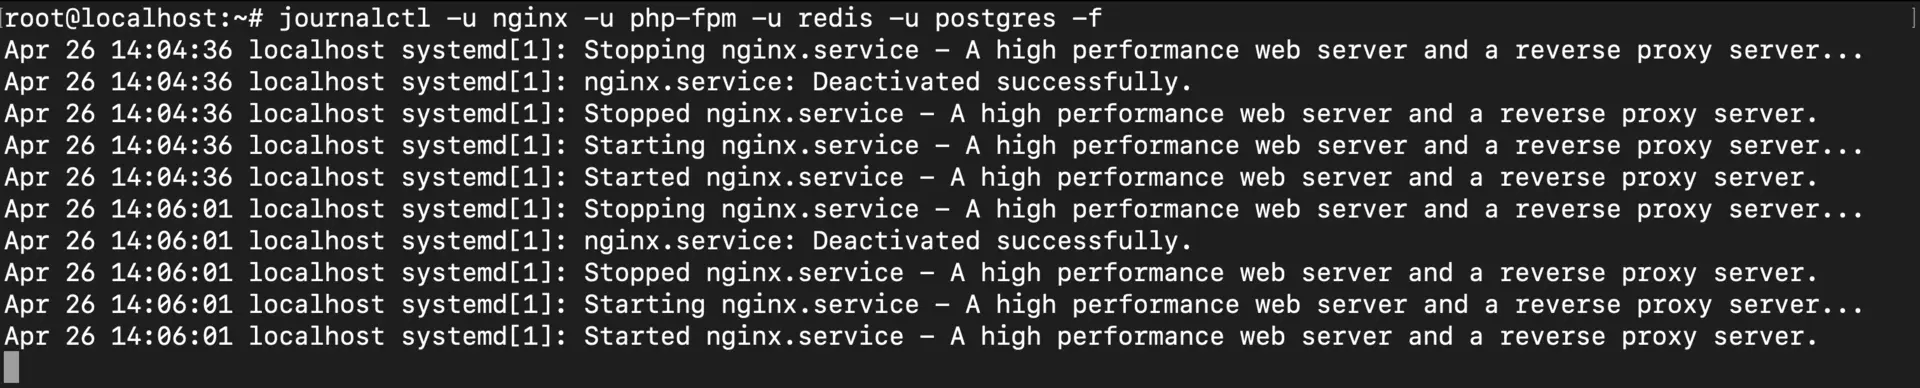
This is what I call “full-stack monitoring” in the terminal. You see requests hitting nginx, php-fpm processing them, redis caching data, and postgres handling queries—all in one unified timeline. When performance issues crop up, you can pinpoint exactly which layer is the bottleneck.
Highlighting Logs from Multiple Services
When you’re watching logs from multiple services in one stream, things can get messy fast. Which line came from nginx? Which from mysql? Color-coding helps your brain process this information much faster.
Using grep and ANSI Color Codes
# Different colors for different services
journalctl -u nginx -u mysql -f | grep --color=always -E 'nginx|mysql|$' | \
sed 's/nginx/\x1b[36mnginx\x1b[0m/g; s/mysql/\x1b[33mmysql\x1b[0m/g'
This is a bit advanced, but it color-codes service names differently. Nginx appears in cyan, mysql in yellow. Your eyes can quickly scan and separate the streams.
If you don’t want to mess with ANSI codes, ccze does the heavy lifting for you:
# Install ccze first: sudo apt install ccze (Debian/Ubuntu)
journalctl -u nginx -u mysql -f | ccze -A
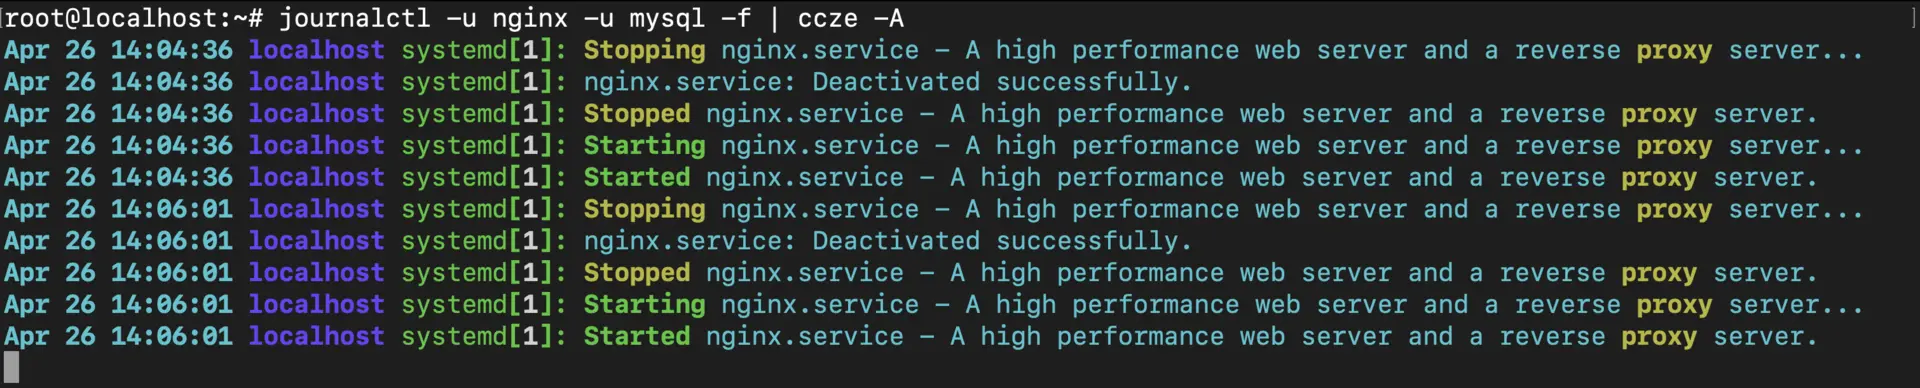
The ccze tool automatically colorizes different log elements—timestamps, service names, error levels, IP addresses, etc. It’s like syntax highlighting for logs. The -A flag preserves ANSI color codes.
Service-Specific Terminals
Sometimes the best solution is the simplest—just use separate terminal windows:
# Terminal 1
journalctl -u nginx -f

# Terminal 2
journalctl -u mysql -f
Arrange them side-by-side or use a terminal multiplexer like tmux. You get complete visual separation, but can still correlate events by timestamp. This is my go-to approach when debugging complex interactions.
Journalctl isn’t just for human eyeballs—it can output logs in formats perfect for scripts, monitoring tools, or data pipelines.
JSON Output for Programmatic Processing
# Stream logs in JSON format
journalctl -f -o json
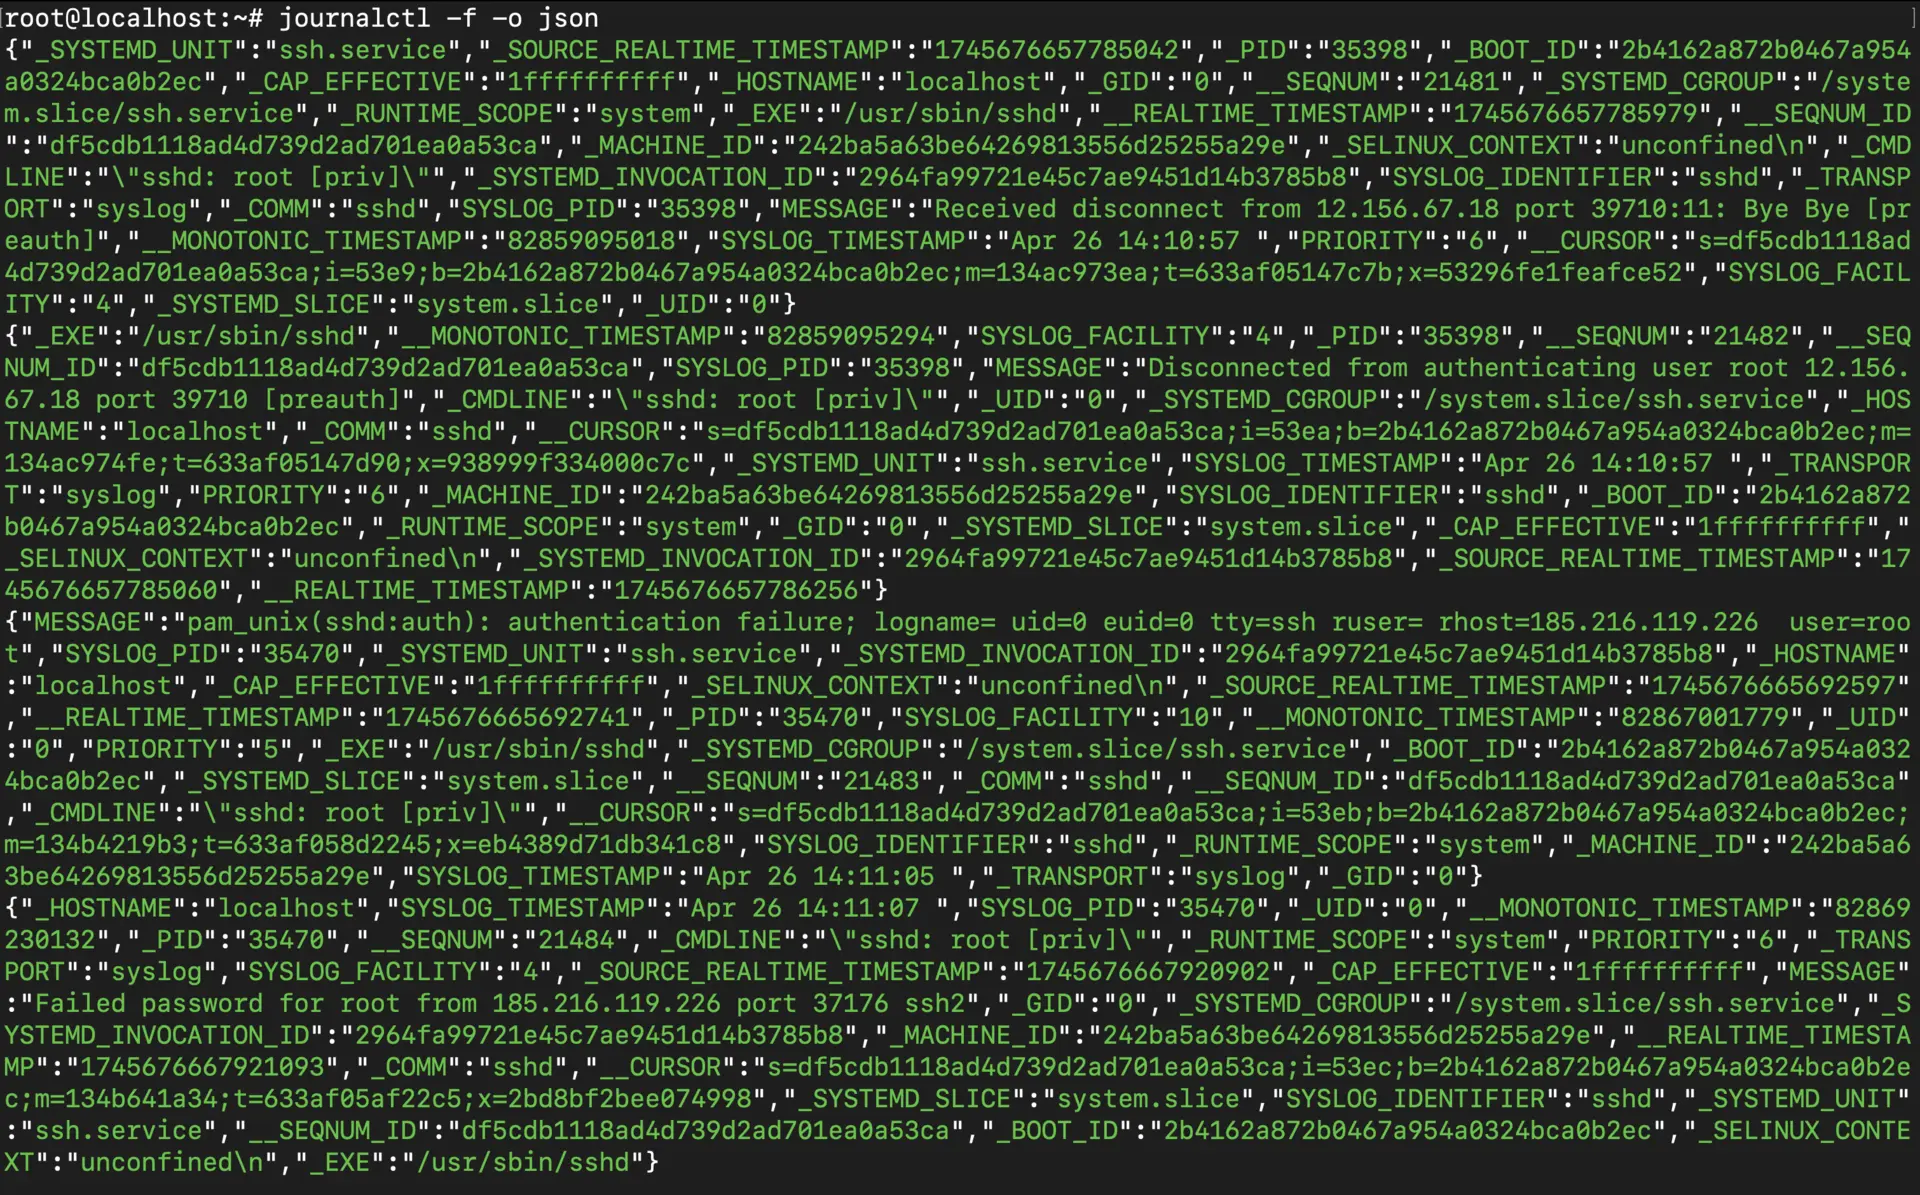
Each log entry becomes a JSON object with all its metadata. This is incredibly useful when you want to process logs programmatically. Pipe it to jq and you can do some powerful filtering:
# Stream logs in JSON format and filter fields with jq
journalctl -f -o json | jq 'select(.PRIORITY=="3") | {time: ._SOURCE_REALTIME_TIMESTAMP, msg: .MESSAGE}'
This example filters for priority 3 (errors) and extracts just the timestamp and message. You could send this to a monitoring system, save it to a database, or trigger alerts.
# Verbose output with all fields
journalctl -f -o verbose

# Short output format (default)
journalctl -f -o short

# Short-precise format with microsecond timestamps
journalctl -f -o short-precise

# Only the message field
journalctl -f -o cat
The verbose format shows you everything—every field journald captured. It’s overwhelming but sometimes you need that level of detail. The cat format strips away all metadata and just shows messages, which is great for piping to other tools.
Different situations call for different timestamp precision:
# Show ISO 8601 format timestamps
journalctl -f --output=short-iso

# Show RFC 3339 format timestamps
journalctl -f --output=short-precise
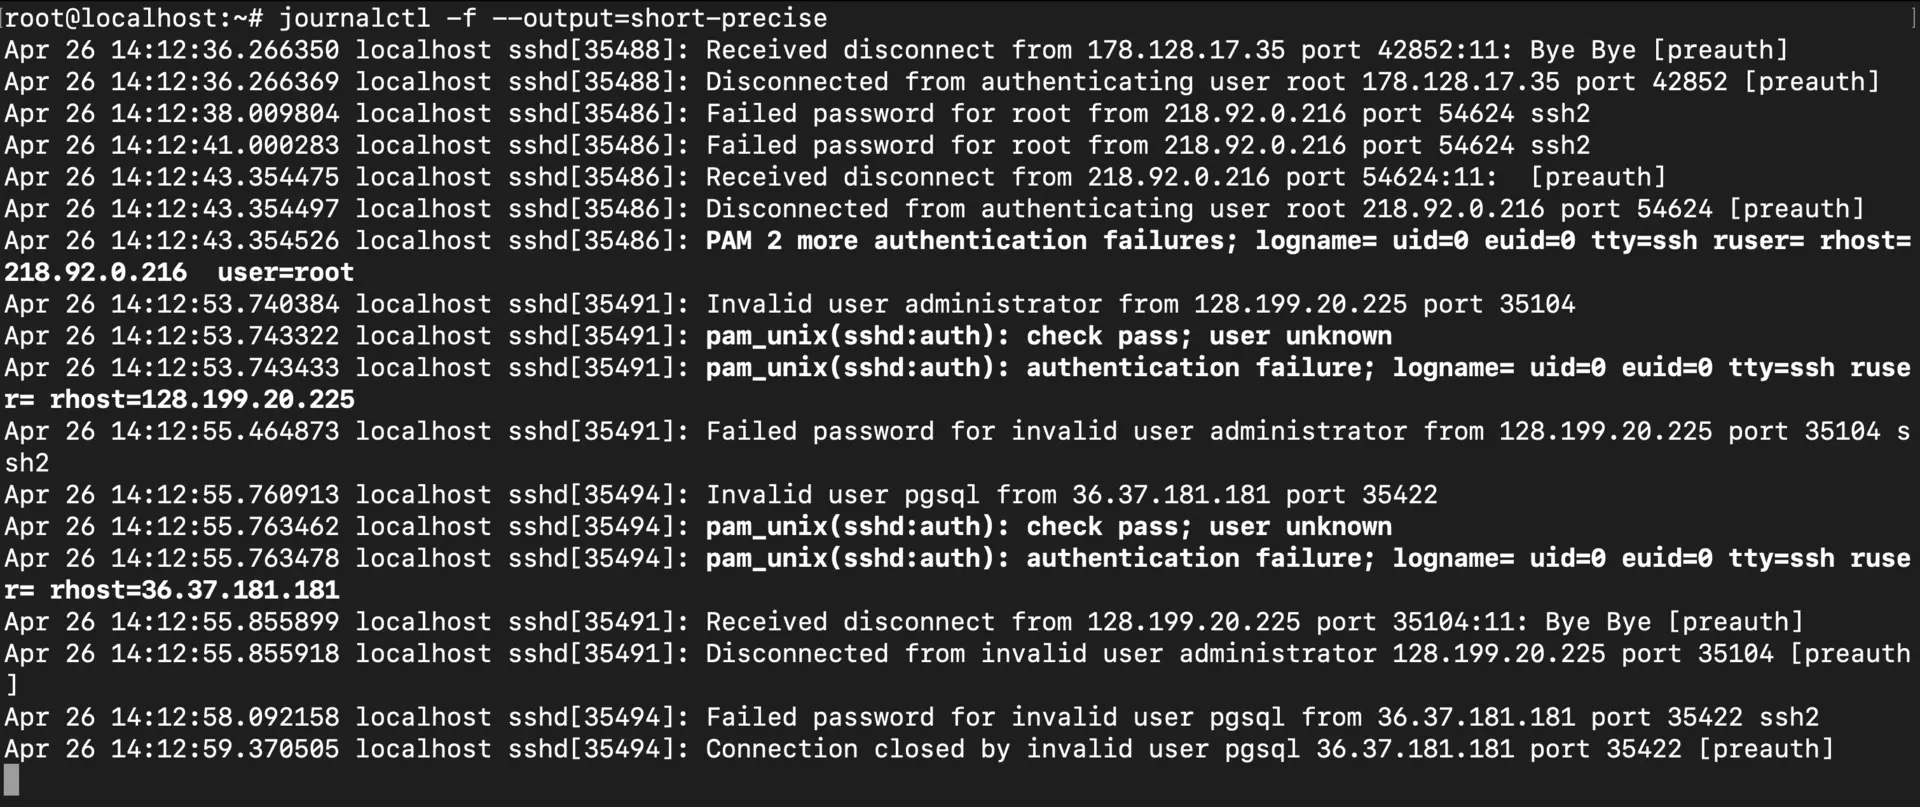
The short-precise format includes microseconds, which is crucial when you’re debugging race conditions or trying to correlate events that happen in rapid succession.
Practical Example: Creating a Custom Monitoring View
# Custom monitoring view with precise timestamps and message prioritization
journalctl -f -o short-precise | \
  grep --color=always -E 'error|warning|critical|$' | \
  sed 's/error/\x1b[31mERROR\x1b[0m/g; s/warning/\x1b[33mWARNING\x1b[0m/g; s/critical/\x1b[35mCRITICAL\x1b[0m/g'
This creates a custom view with microsecond timestamps and color-coded severity levels. Errors show up in red, warnings in yellow, critical messages in magenta. It’s like building your own custom log viewer right in the terminal.
Exporting Logs to Dashboards: Visualizing with Grafana, New Relic, and Datadog
While real-time monitoring with journalctl is useful for quick troubleshooting, dashboards provide long-term visibility, trend analysis, and alerting.
Sending Logs to Grafana Loki
Grafana Loki works seamlessly with Grafana for log visualization. Install Promtail to forward system logs to Loki and build dashboards showing log volume, errors, and service activity.
Integrating with Datadog
Datadog offers end-to-end monitoring with log management. After installing the Datadog Agent, configure it to collect journald logs for real-time analysis and alerts.
Setting Up New Relic Integration
New Relic provides similar capabilities for log and infrastructure monitoring. Install the New Relic agent and connect it to your account to visualize and correlate system logs with performance metrics.
With these tools, you can move beyond terminal monitoring to powerful dashboards that reveal trends, detect anomalies, and keep your systems running smoothly.
Conclusion
Real-time log monitoring with journalctl -f is an essential skill for Linux system administrators and DevOps engineers. By combining the commands and techniques discussed in this guide, you can:
- Quickly identify and troubleshoot issues as they happen
- Filter logs to focus on relevant services and severity levels
- Customize your view with highlighting and formatting
- Export logs to dashboards for long-term monitoring and analysis
The ability to effectively monitor logs in real-time can drastically reduce troubleshooting time and help maintain system stability. Remember that different situations call for different monitoring approaches—sometimes a simple journalctl -f is sufficient, while complex issues might require sophisticated filtering and visualization.