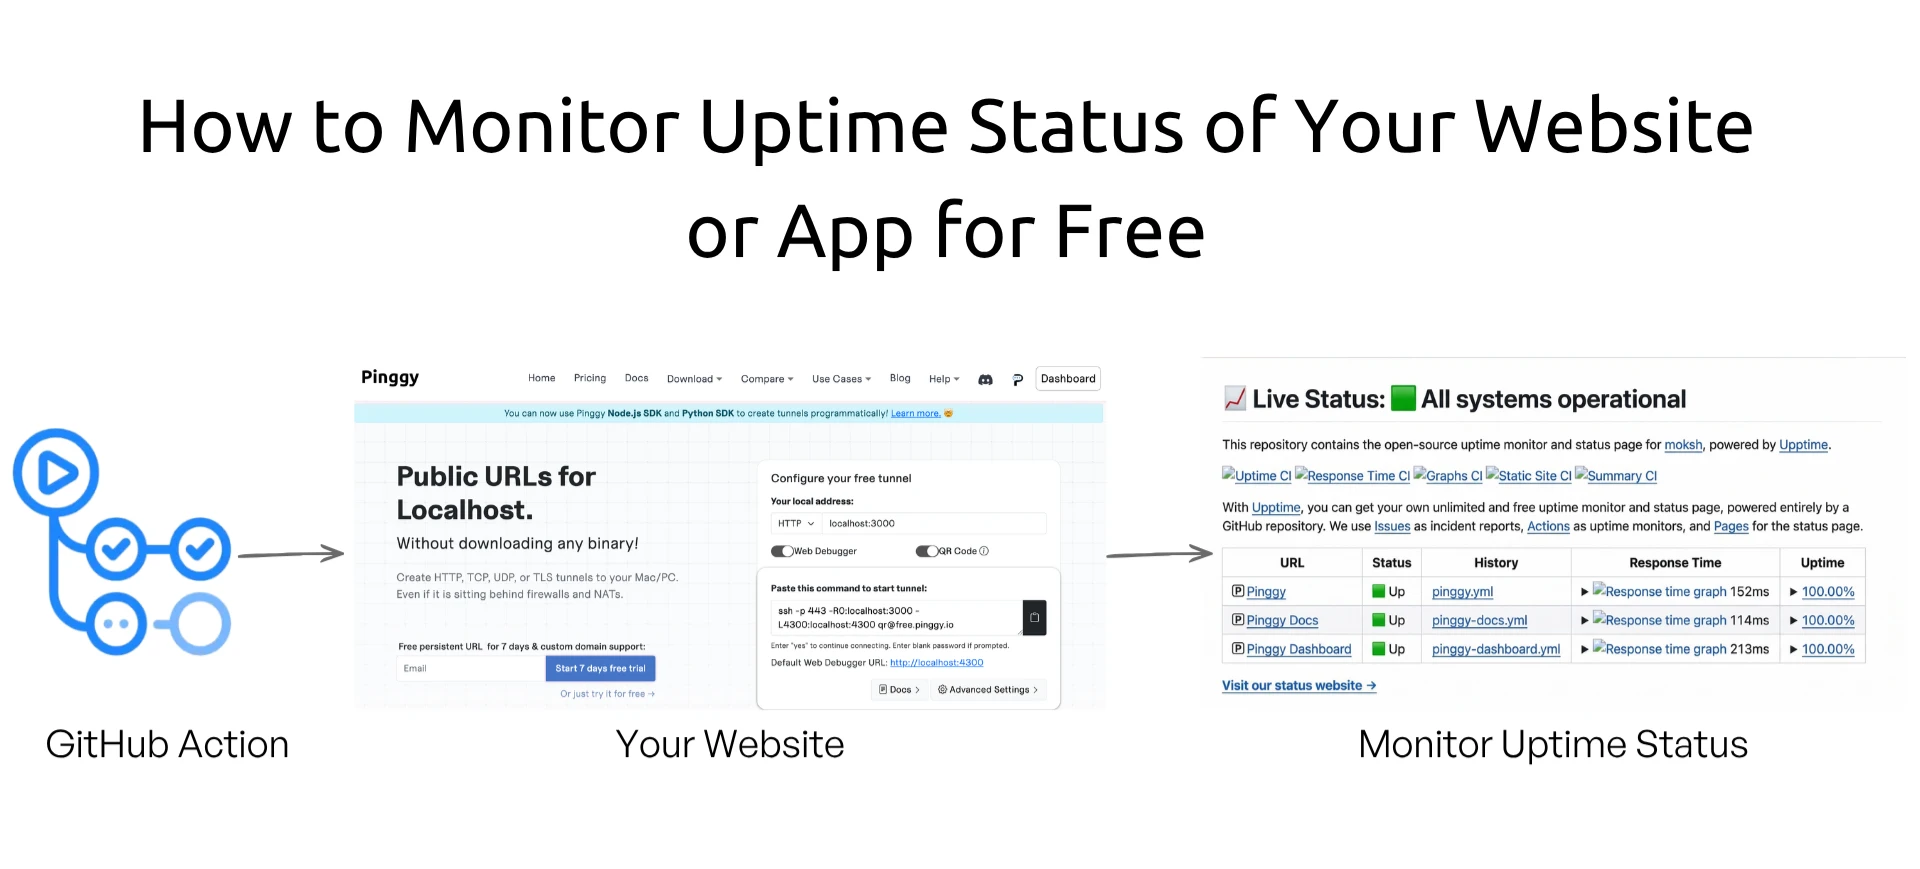
How to Monitor Uptime Status of Your Website or App for Free
Updated on Mar 20, 2026 · 10 mins read
Every developer has experienced the uncomfortable surprise of learning from a user rather than their own monitoring system that their website has been down for the past hour. Uptime monitoring is not optional for any serious web application. But many solutions that do this well come with a monthly price tag, require you to maintain a separate server, or lock your data inside a third-party platform. What if you could get reliable uptime monitoring, a polished public status page, and incident tracking completely for free, with zero infrastructure to manage?
That is exactly what Upptime delivers. It is an open-source uptime monitoring tool that runs entirely on GitHub infrastructure no external servers, no paid subscriptions, no vendor lock-in. If you already have a GitHub account, you can have a fully functional monitoring system up and running in under ten minutes.
Summary
Upptime is a free, open-source uptime monitor and status page powered entirely by GitHub Actions, GitHub Issues, and GitHub Pages. No servers. No subscriptions.
- Monitoring: Checks your endpoints every 5 minutes via GitHub Actions cron jobs.
- Incident tracking: Automatically opens and closes GitHub Issues when downtime is detected.
- Status page: Generates a responsive PWA status website hosted on GitHub Pages for free.
- Notifications: Supports Slack, Discord, Telegram, MS Teams, email (SMTP, SendGrid, AWS SES), and SMS (Twilio, Nexmo).
- Badges: Embeddable uptime and response time badges for your README via Shields.io.
- Setup: Create a repo from the Upptime template, add a
GH_PATsecret, and edit.upptimerc.ymlwith your URLs. - Cost: Free for public repos (unlimited GitHub Actions minutes). Private repos use paid Actions minutes.
What Is Uptime Monitoring and Why Does It Matter?
Uptime monitoring is the practice of periodically checking whether your website, API, or service is accessible and responding within an acceptable time. A monitoring system sends automated requests to your endpoints at regular intervals and records the result either a successful response or a failure. When a failure is detected, it alerts you immediately so you can investigate and fix the problem before it affects more users.
For users visiting your site, downtime translates directly into lost trust and lost revenue. Research consistently shows that users abandon pages that fail to load within a few seconds. For a SaaS product, an unmonitored outage can lead to angry support tickets, churn, and SLA violations. For a developer portfolio or open-source project, it signals neglect.
The challenge for individuals and small teams is that commercial uptime monitoring services while excellent can become expensive once you monitor more than a handful of endpoints. Upptime solves this by doing something genuinely clever: it repurposes GitHub’s existing free infrastructure to do the entire job.
Introducing Upptime: GitHub as Your Monitoring Backend
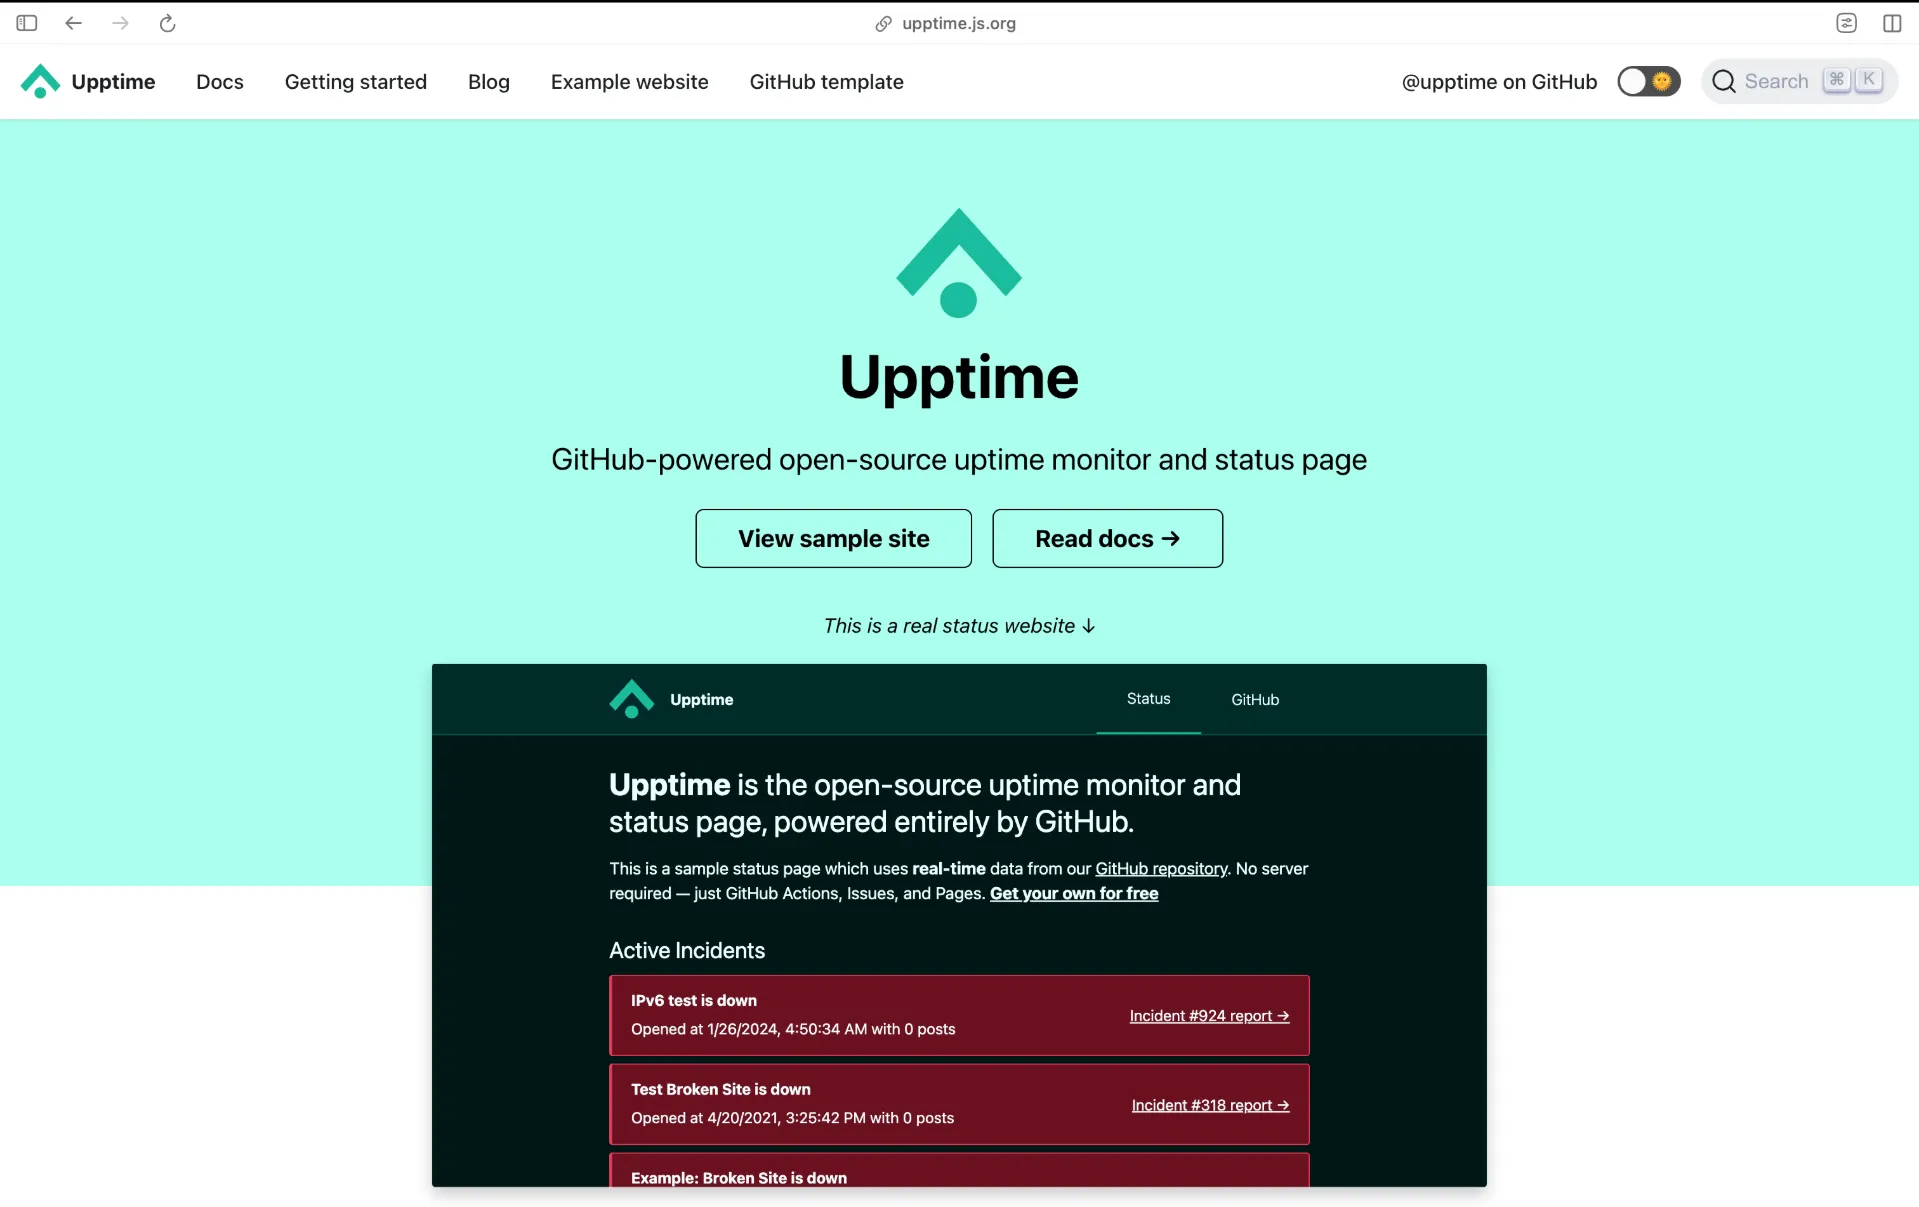
Upptime, created by open-source developer Anand Chowdhary and supported by Pabio, has earned over 16,900 stars on GitHub since its release. The project has been used by organizations including Canonical and WakaTime, and CSS-Tricks called it “an incredibly clever usage of GitHub Actions.”
The core idea is elegant. GitHub Actions can be scheduled to run on a cron schedule, just like a traditional monitoring server would. Those actions can make HTTP requests and inspect responses. GitHub Issues can serve as a structured incident log automatically opened when a service goes down and closed when it recovers. GitHub Pages can host a generated static status website. By combining these three free GitHub services, Upptime creates a complete monitoring pipeline without you having to run a single server.
Because all data is stored directly in your repository as commits and issues, your entire monitoring history is version-controlled, auditable, and fully under your control. There is no proprietary database to worry about, and no risk of losing your data if a third-party service shuts down.
How Upptime Works Under the Hood
Upptime operates through several coordinated GitHub Actions workflows that run on your repository:
Uptime CI runs every 5 minutes. It checks each of your configured endpoints with an HTTP request, records whether the response was successful, and commits response time data to your repository. If an endpoint fails, it creates a new GitHub Issue titled with the site name and status. If the issue was previously opened and the site recovers, it automatically closes the issue.
Response Time CI runs every 6 hours. It records detailed response time metrics and commits them to the repository. Over time, this builds a historical record that is used to generate the response time graphs visible on your status page.
Graphs CI runs daily. It reads the historical response time data from the git history and generates SVG graphs that are committed to the repository and displayed on the status page.
Static Site CI is triggered whenever changes are pushed to the main branch. It rebuilds the status page from your configuration and data, then deploys it to GitHub Pages.
The status page itself is a Progressive Web App (PWA) built with Svelte. It pulls live data directly from the GitHub API, displays uptime percentages across configurable time ranges (24 hours, 7 days, 30 days, 1 year), and shows a timeline of past incidents.
Setting Up Upptime: Step-by-Step Guide
Getting started with Upptime takes only a few minutes if you follow these steps carefully.
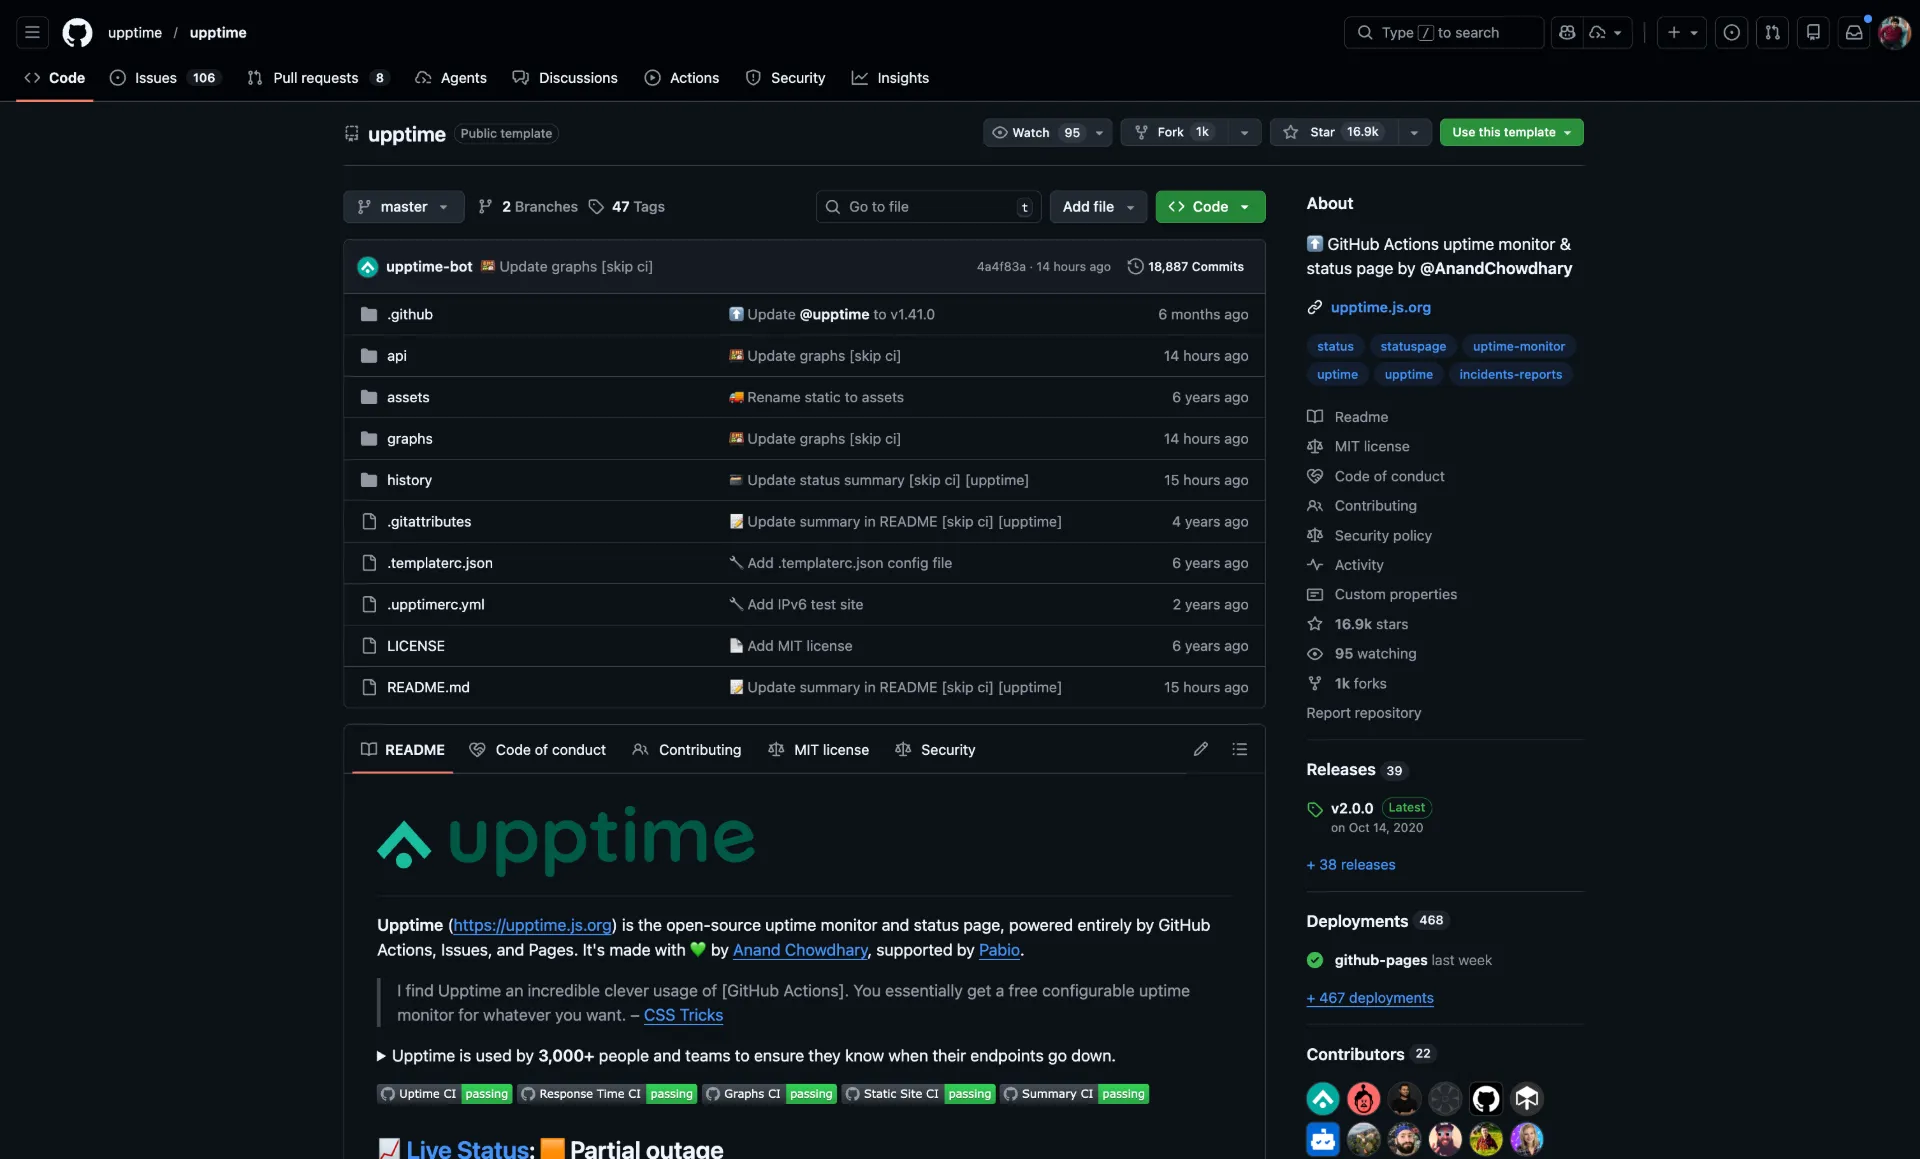
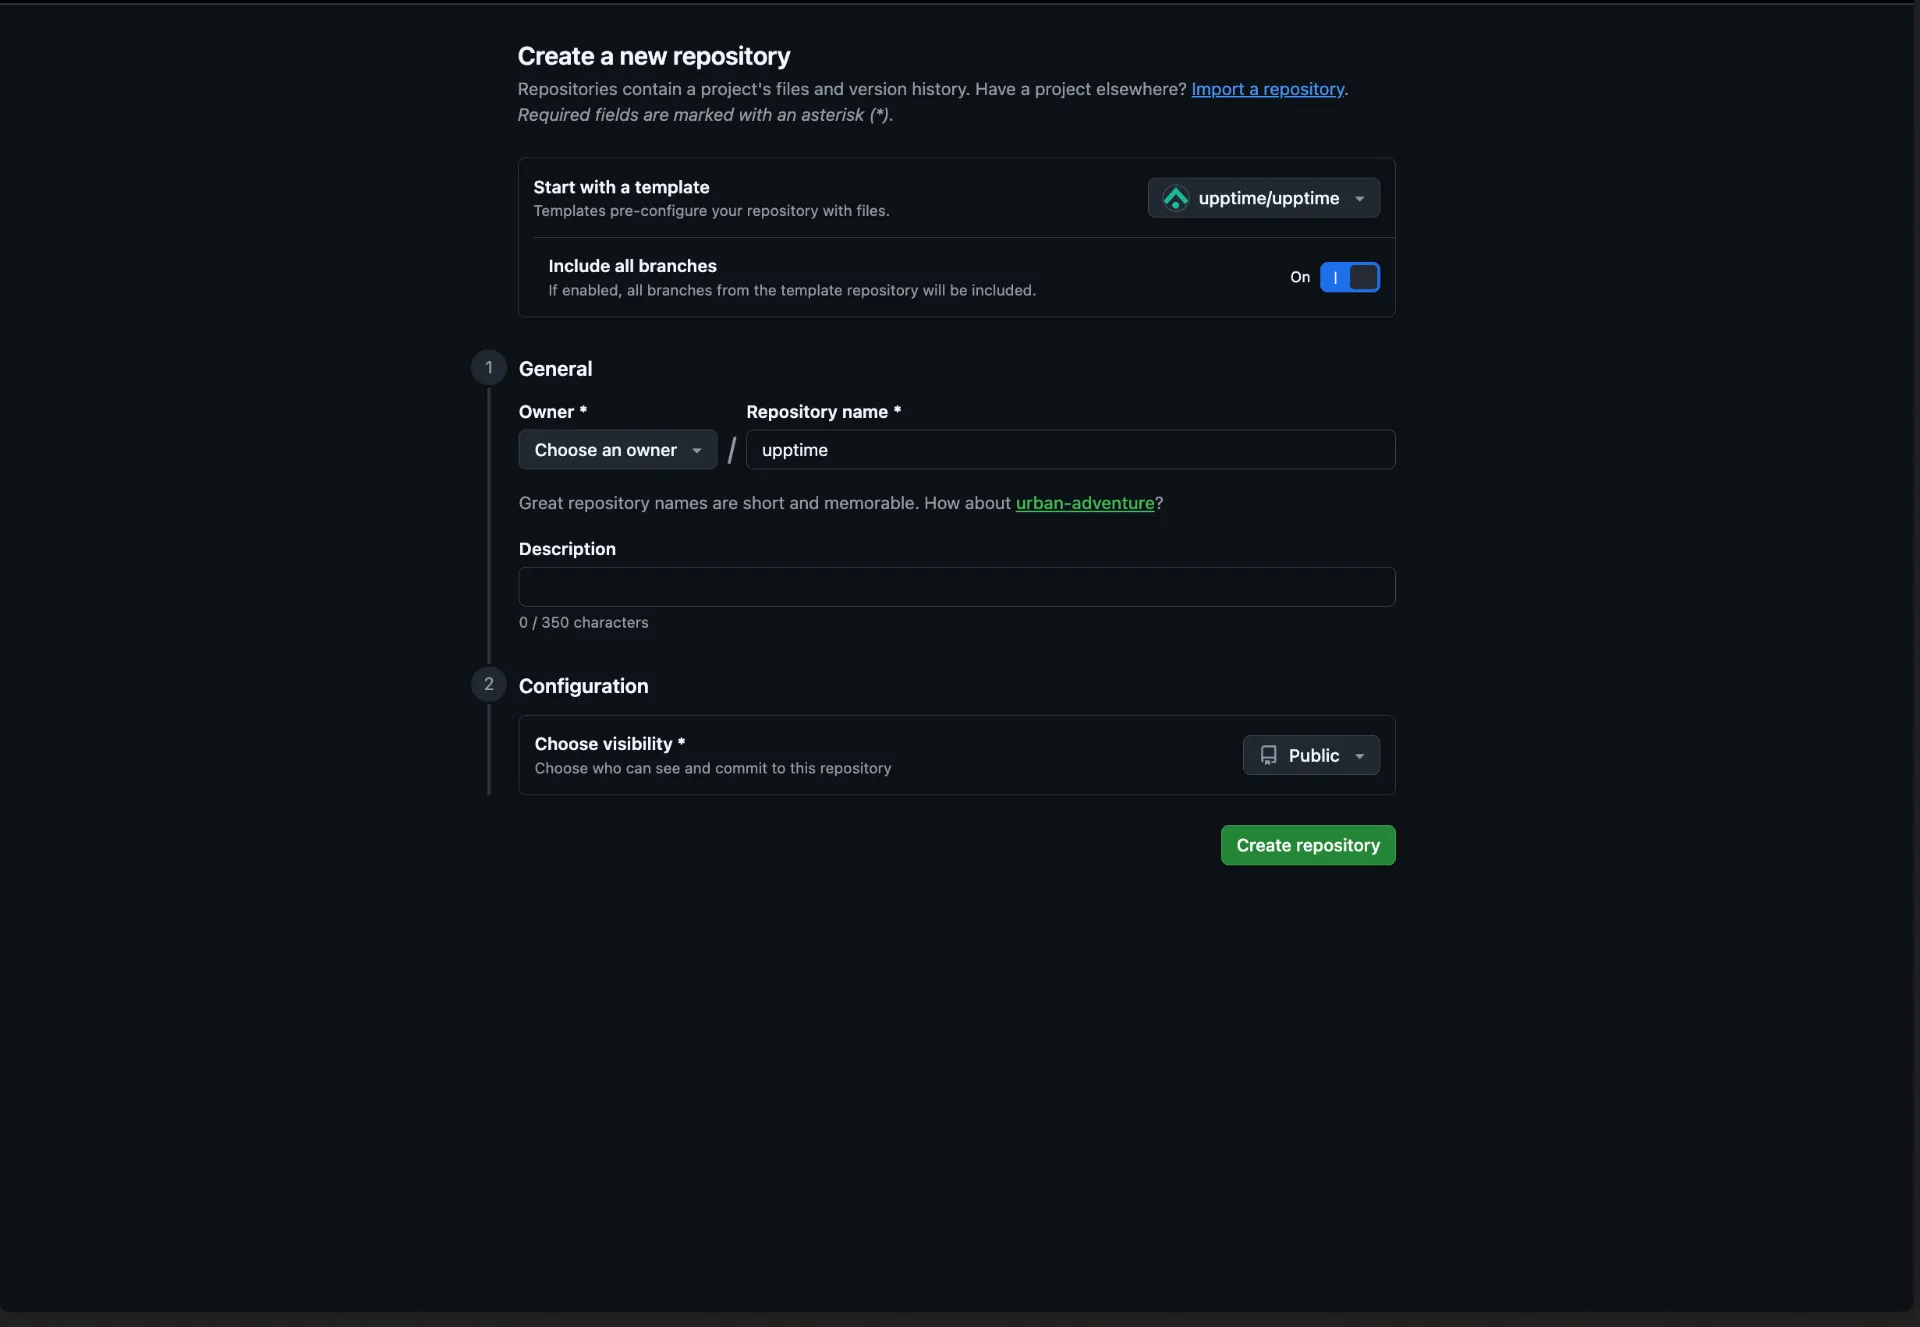
Step 1: Create Your Repository from the Template
Navigate to the
Upptime GitHub repository and click “Use this template” → “Create a new repository”. Give your repository a name (for example, my-status-page), decide whether it should be public or private, and make sure to include all branches. Public repositories are recommended since GitHub Actions minutes are unlimited for public repos.
Step 2: Enable GitHub Actions
Once your repository is created, go to the Actions tab. GitHub may prompt you to enable workflows on a newly forked or templated repository. Click the button to enable them. You should see all the Upptime workflows listed there.
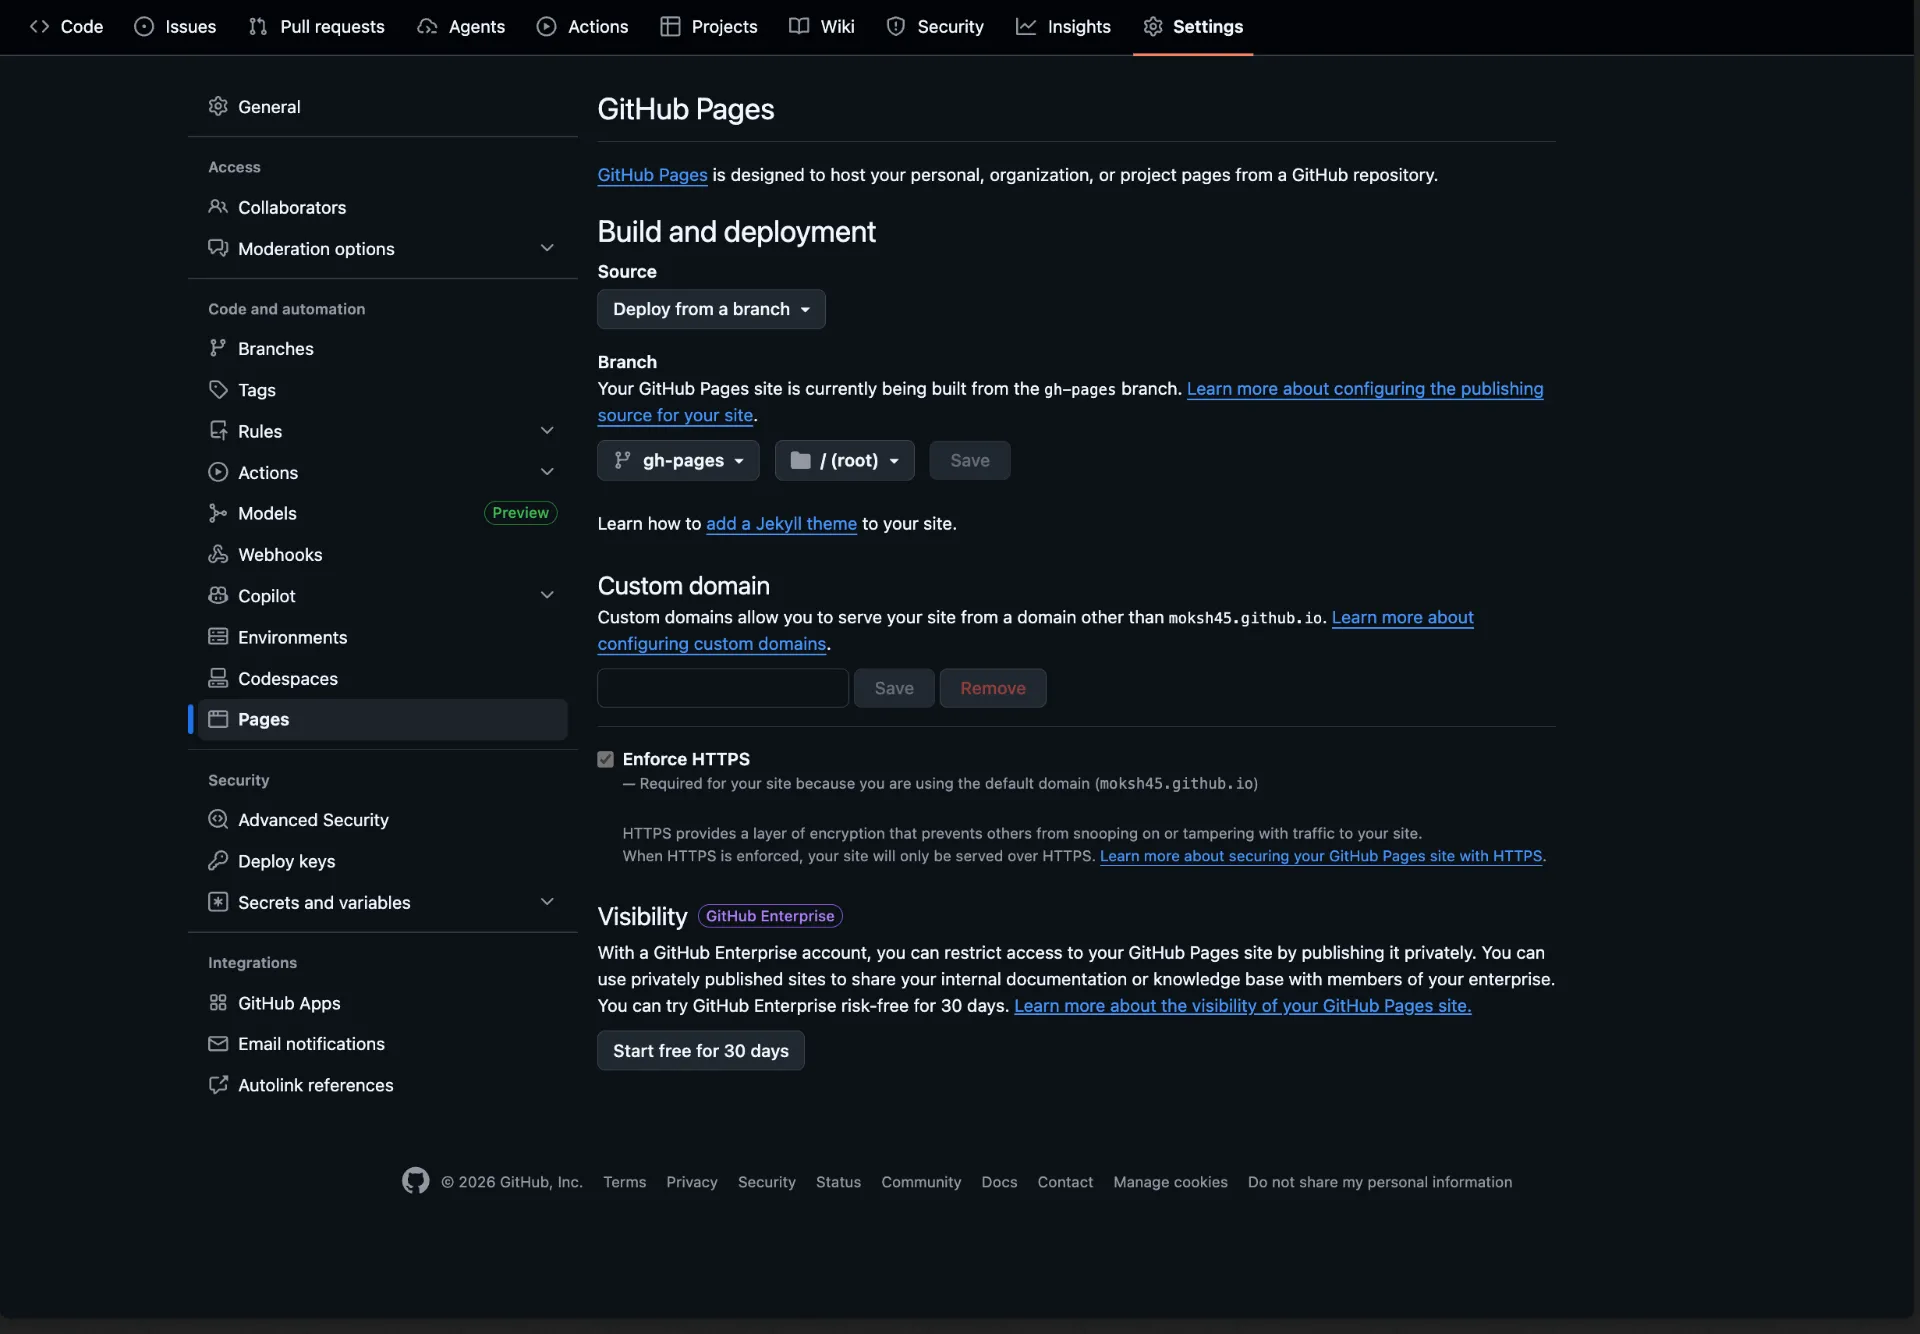
Step 3: Configure GitHub Pages
Go to your repository Settings → Pages. Under the “Source” section, change the branch from “None” to gh-pages and set the directory to / (root). Save the settings. GitHub will now host your status page at https://<your-username>.github.io/<your-repo-name>/.
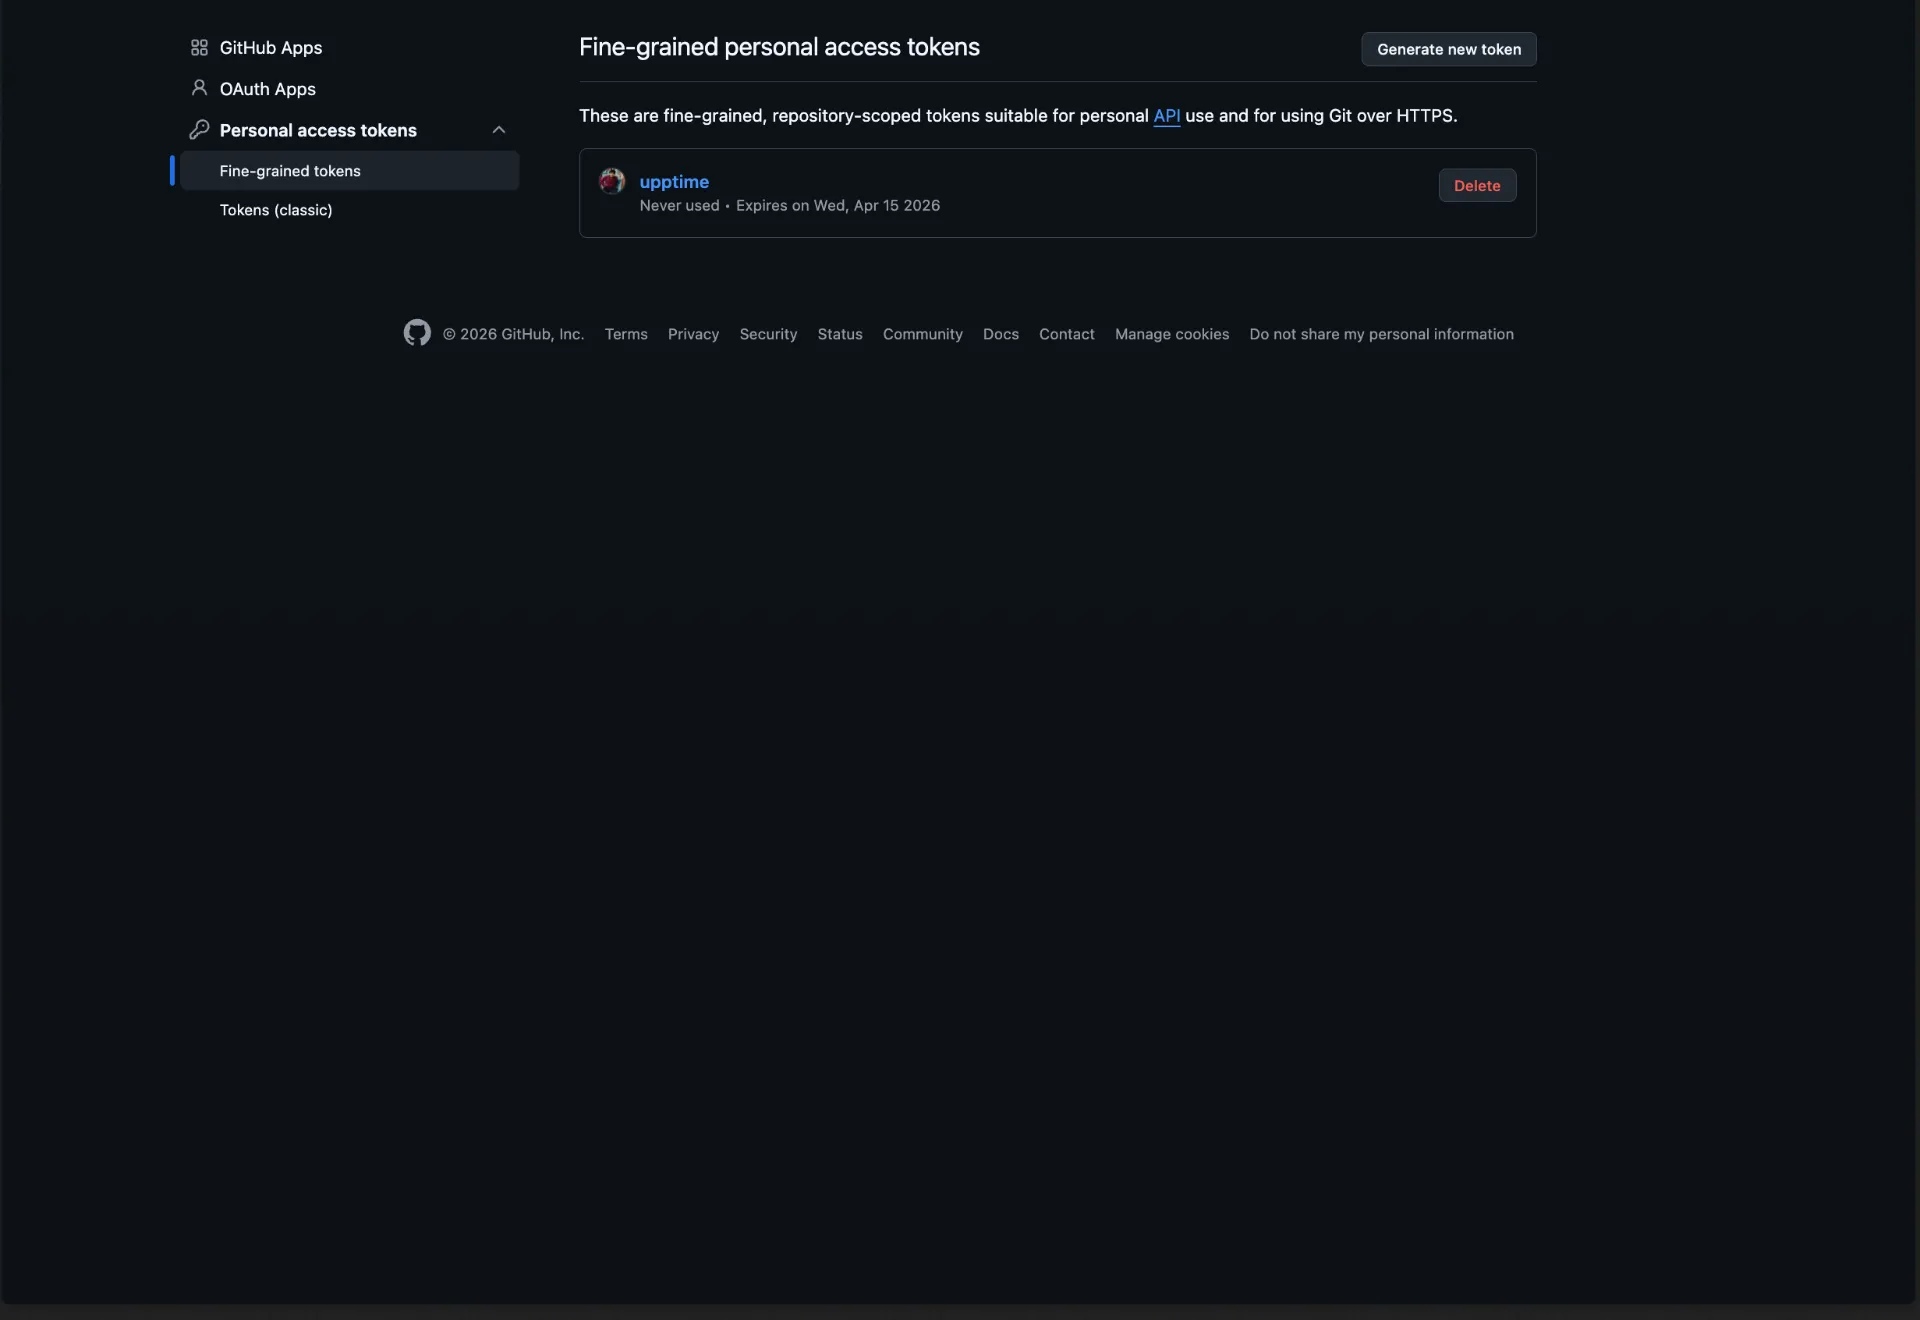
Step 4: Create a Personal Access Token
Upptime needs permission to create and close issues, commit data, and trigger workflows on your behalf. Go to your GitHub Settings → Developer settings → Personal access tokens → Fine-grained tokens (or classic tokens with the repo and workflow scopes). Generate a token with read-write access to Actions, Contents, Issues, and Workflows.
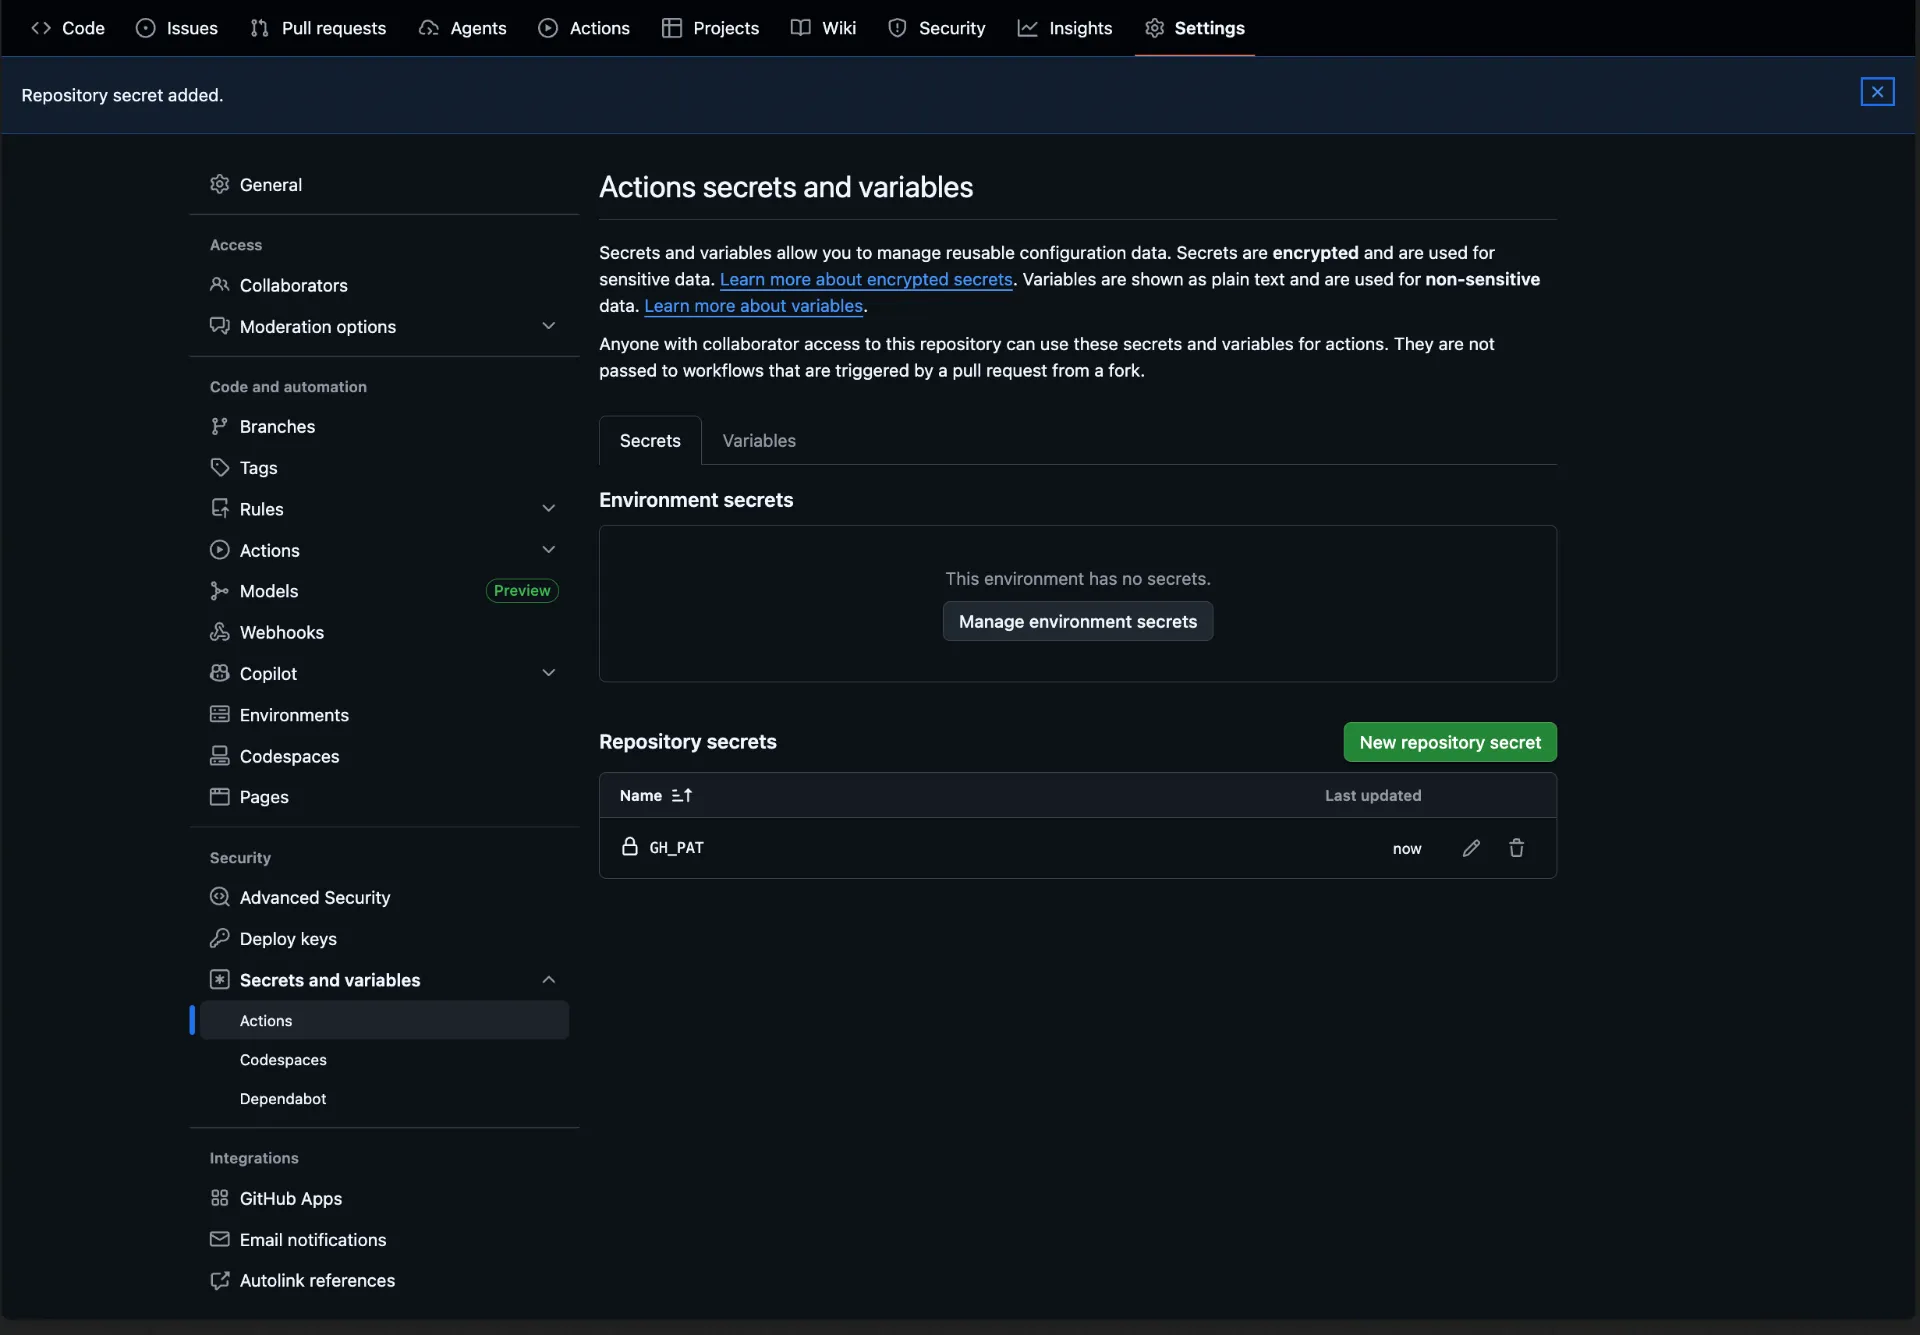
Back in your repository, go to Settings → Secrets and variables → Actions, and add a new repository secret named GH_PAT with the token value you just created.
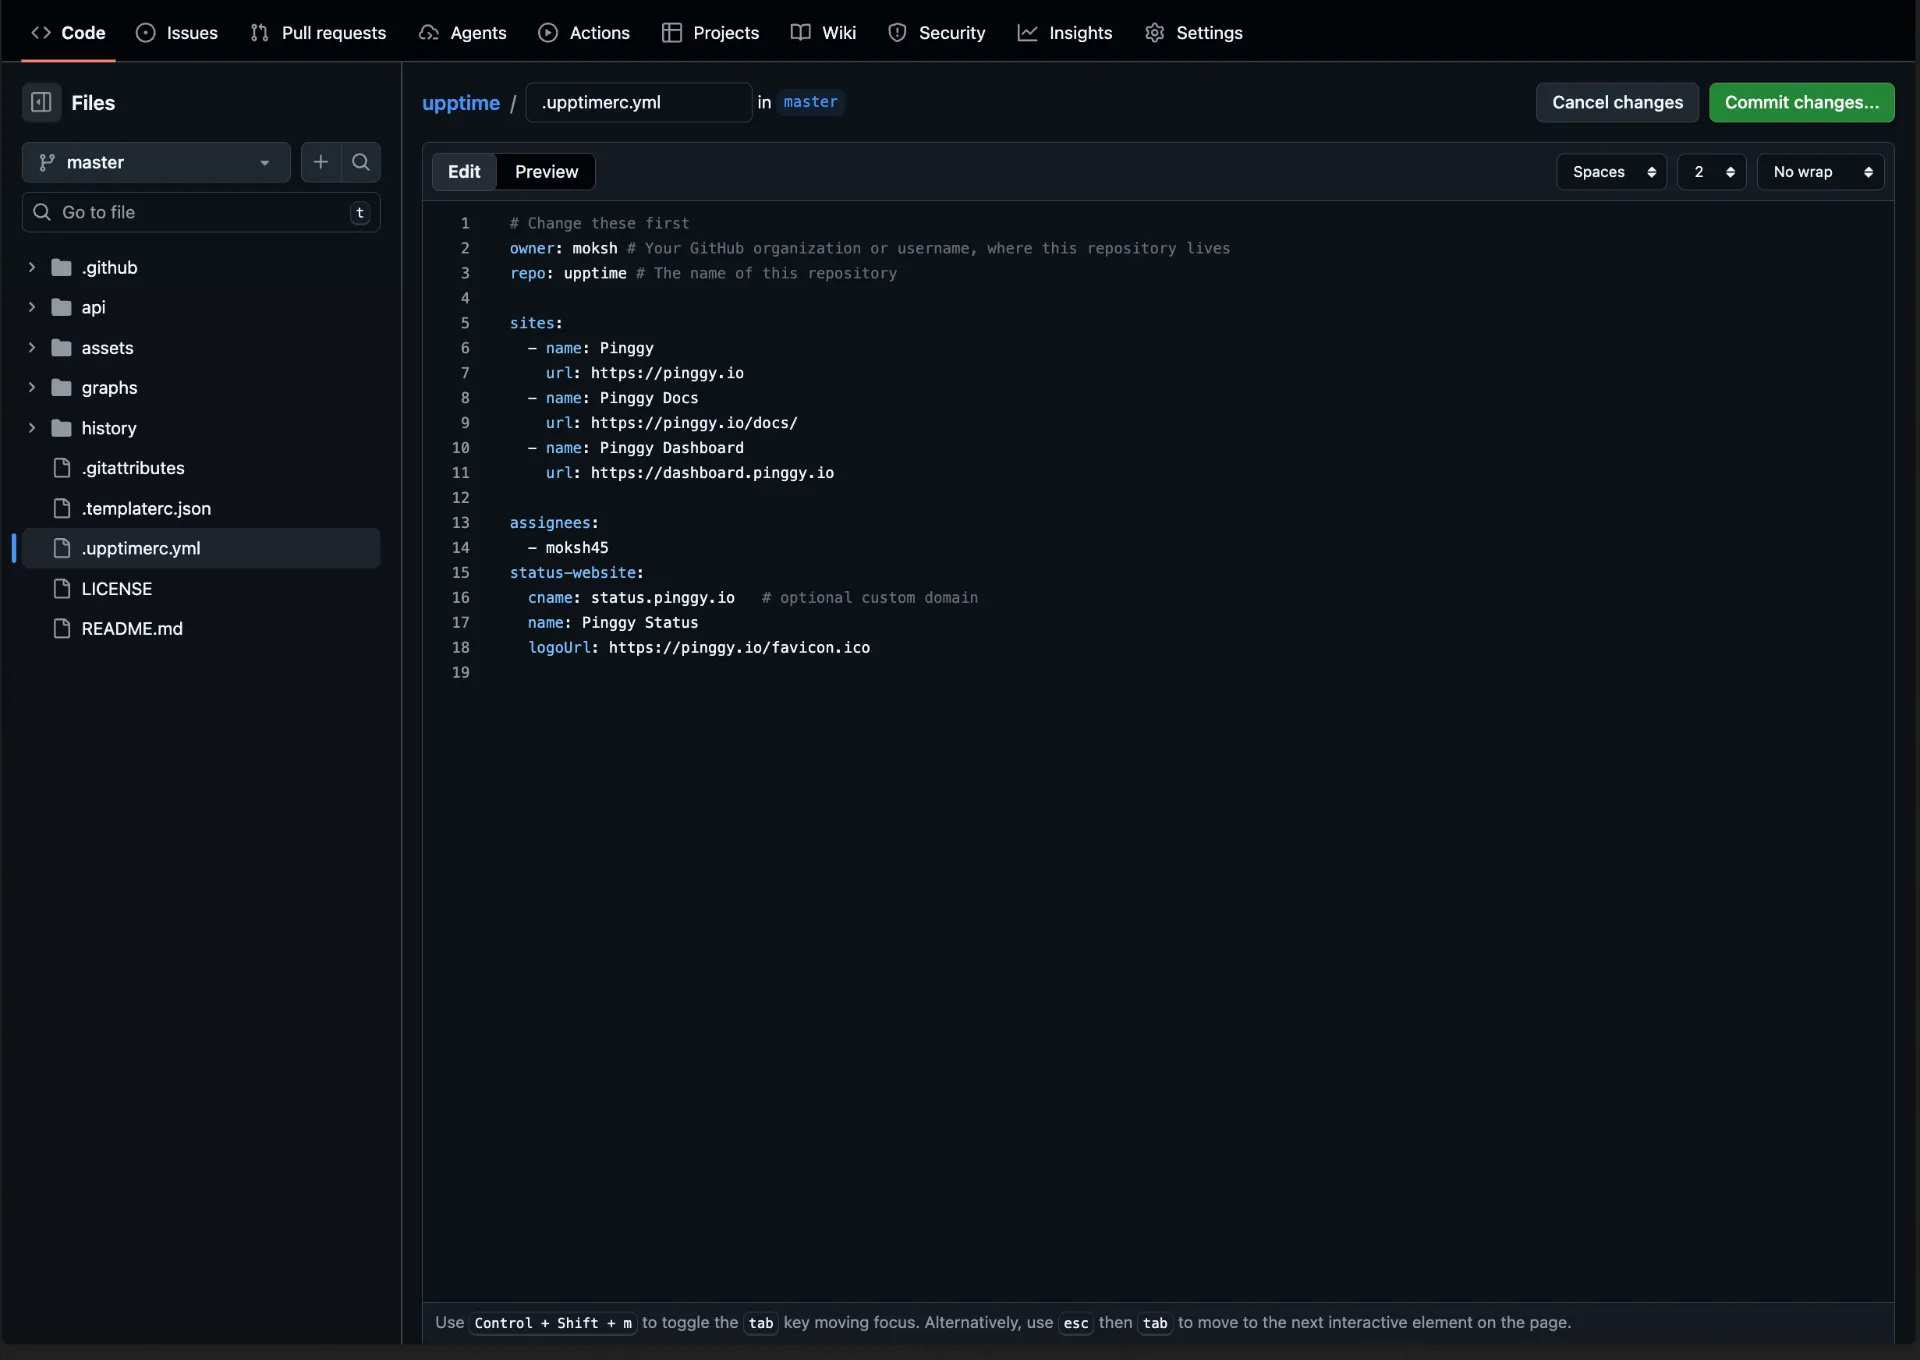
Step 5: Edit .upptimerc.yml
This is the only configuration file you need to edit. Open .upptimerc.yml in your repository and update it with your GitHub username, repository name, and the list of URLs you want to monitor:
owner: your-github-username
repo: your-repo-name
sites:
  - name: Pinggy
    url: https://pinggy.io
  - name: Pinggy Docs
    url: https://pinggy.io/docs/
  - name: Pinggy Dashboard
    url: https://dashboard.pinggy.io
assignees:
  - your-github-username
status-website:
  cname: status.pinggy.io   # optional custom domain
  name: Pinggy Status
  logoUrl: https://pinggy.io/favicon.ico
Commit and push the file. This will trigger the Static Site CI workflow and kick off the first monitoring check.
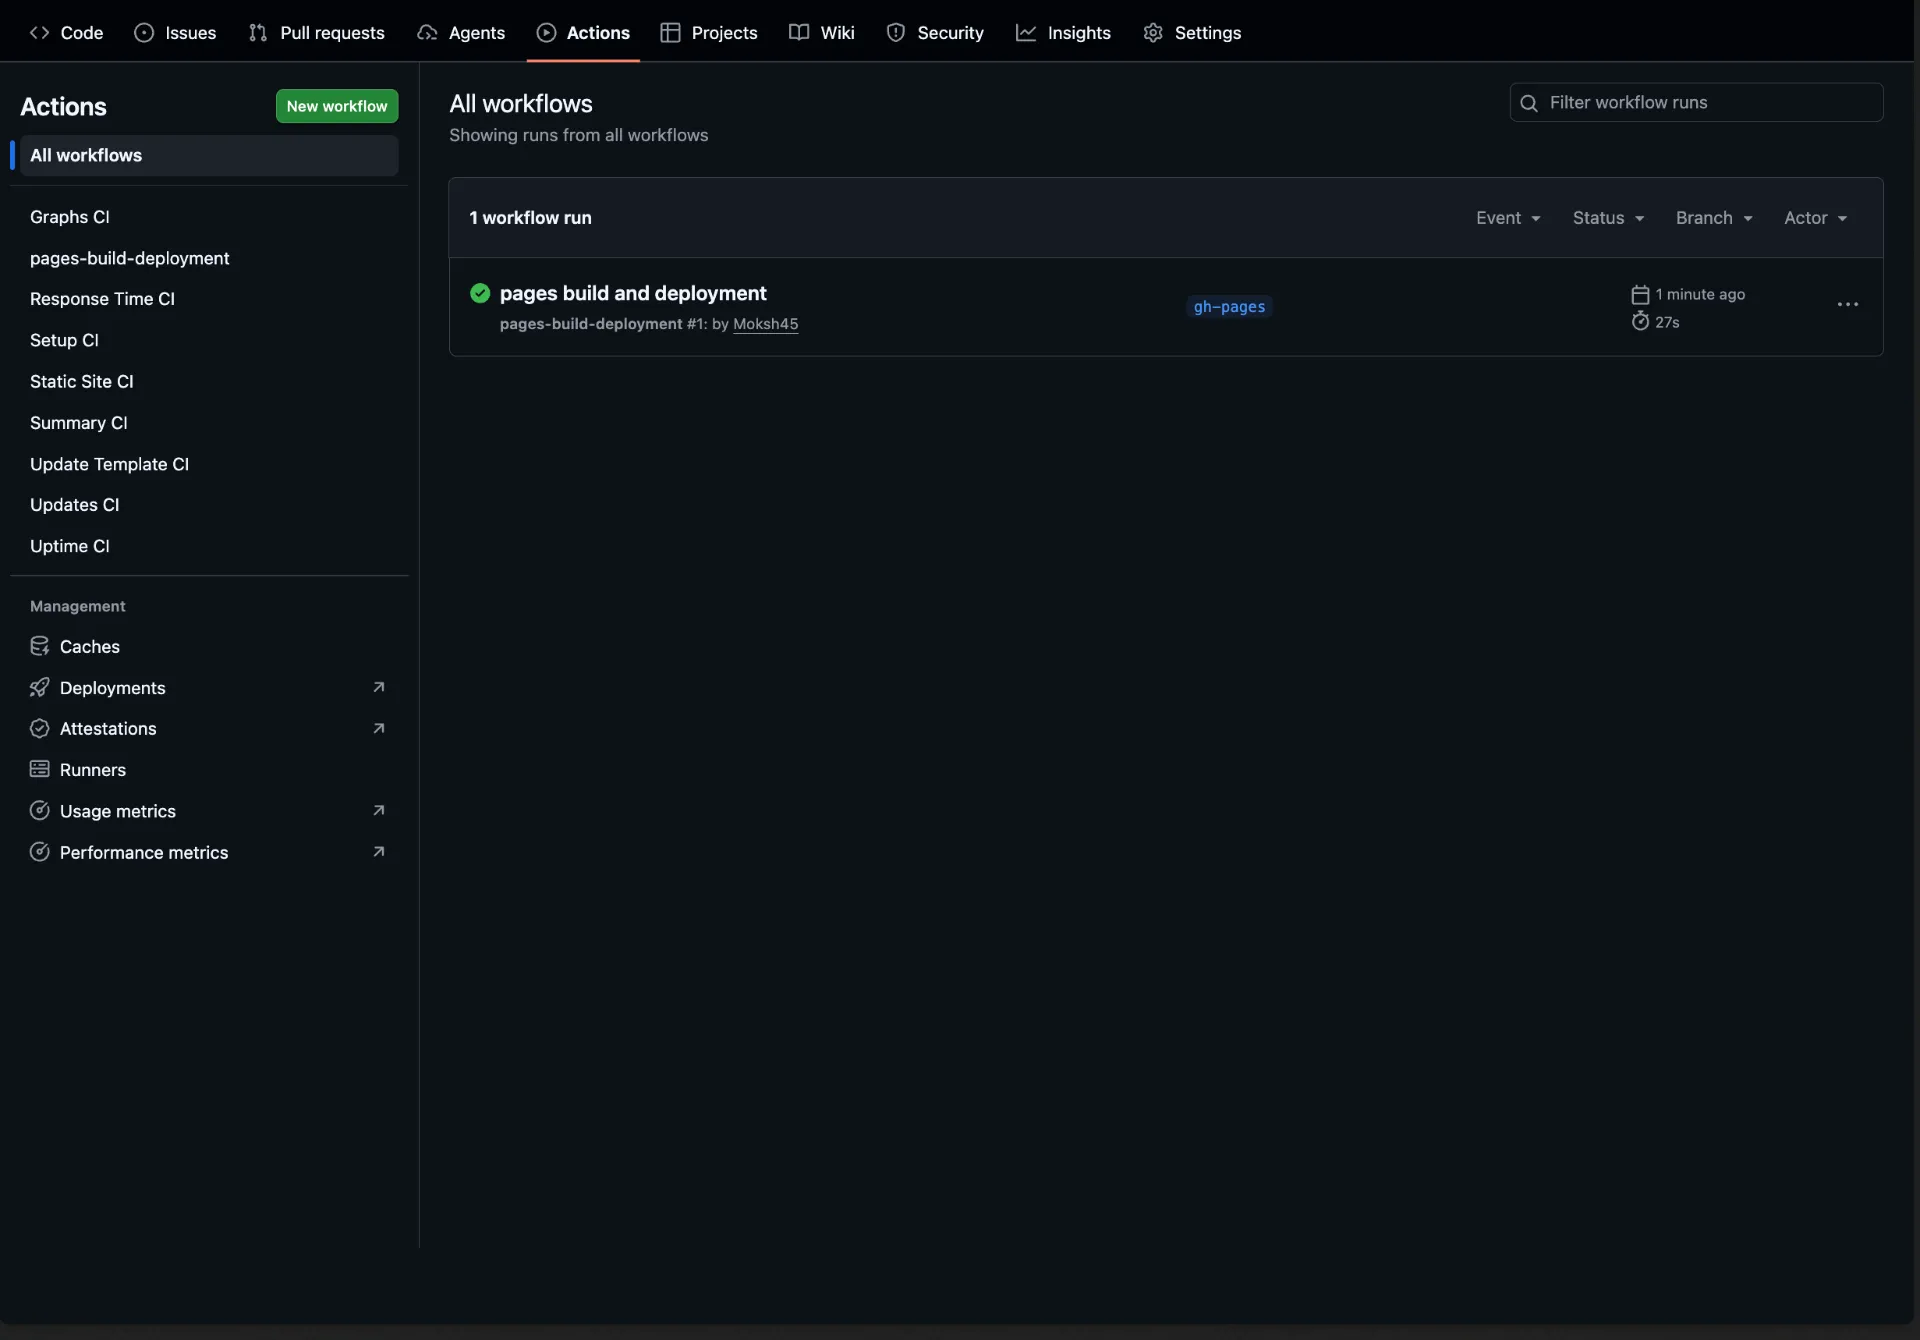
Step 6: Verify It Is Working
Head to the Actions tab and watch the workflows run. Within a few minutes, the Uptime CI workflow should complete its first check. A green checkmark next to the workflow run confirms everything is working correctly.
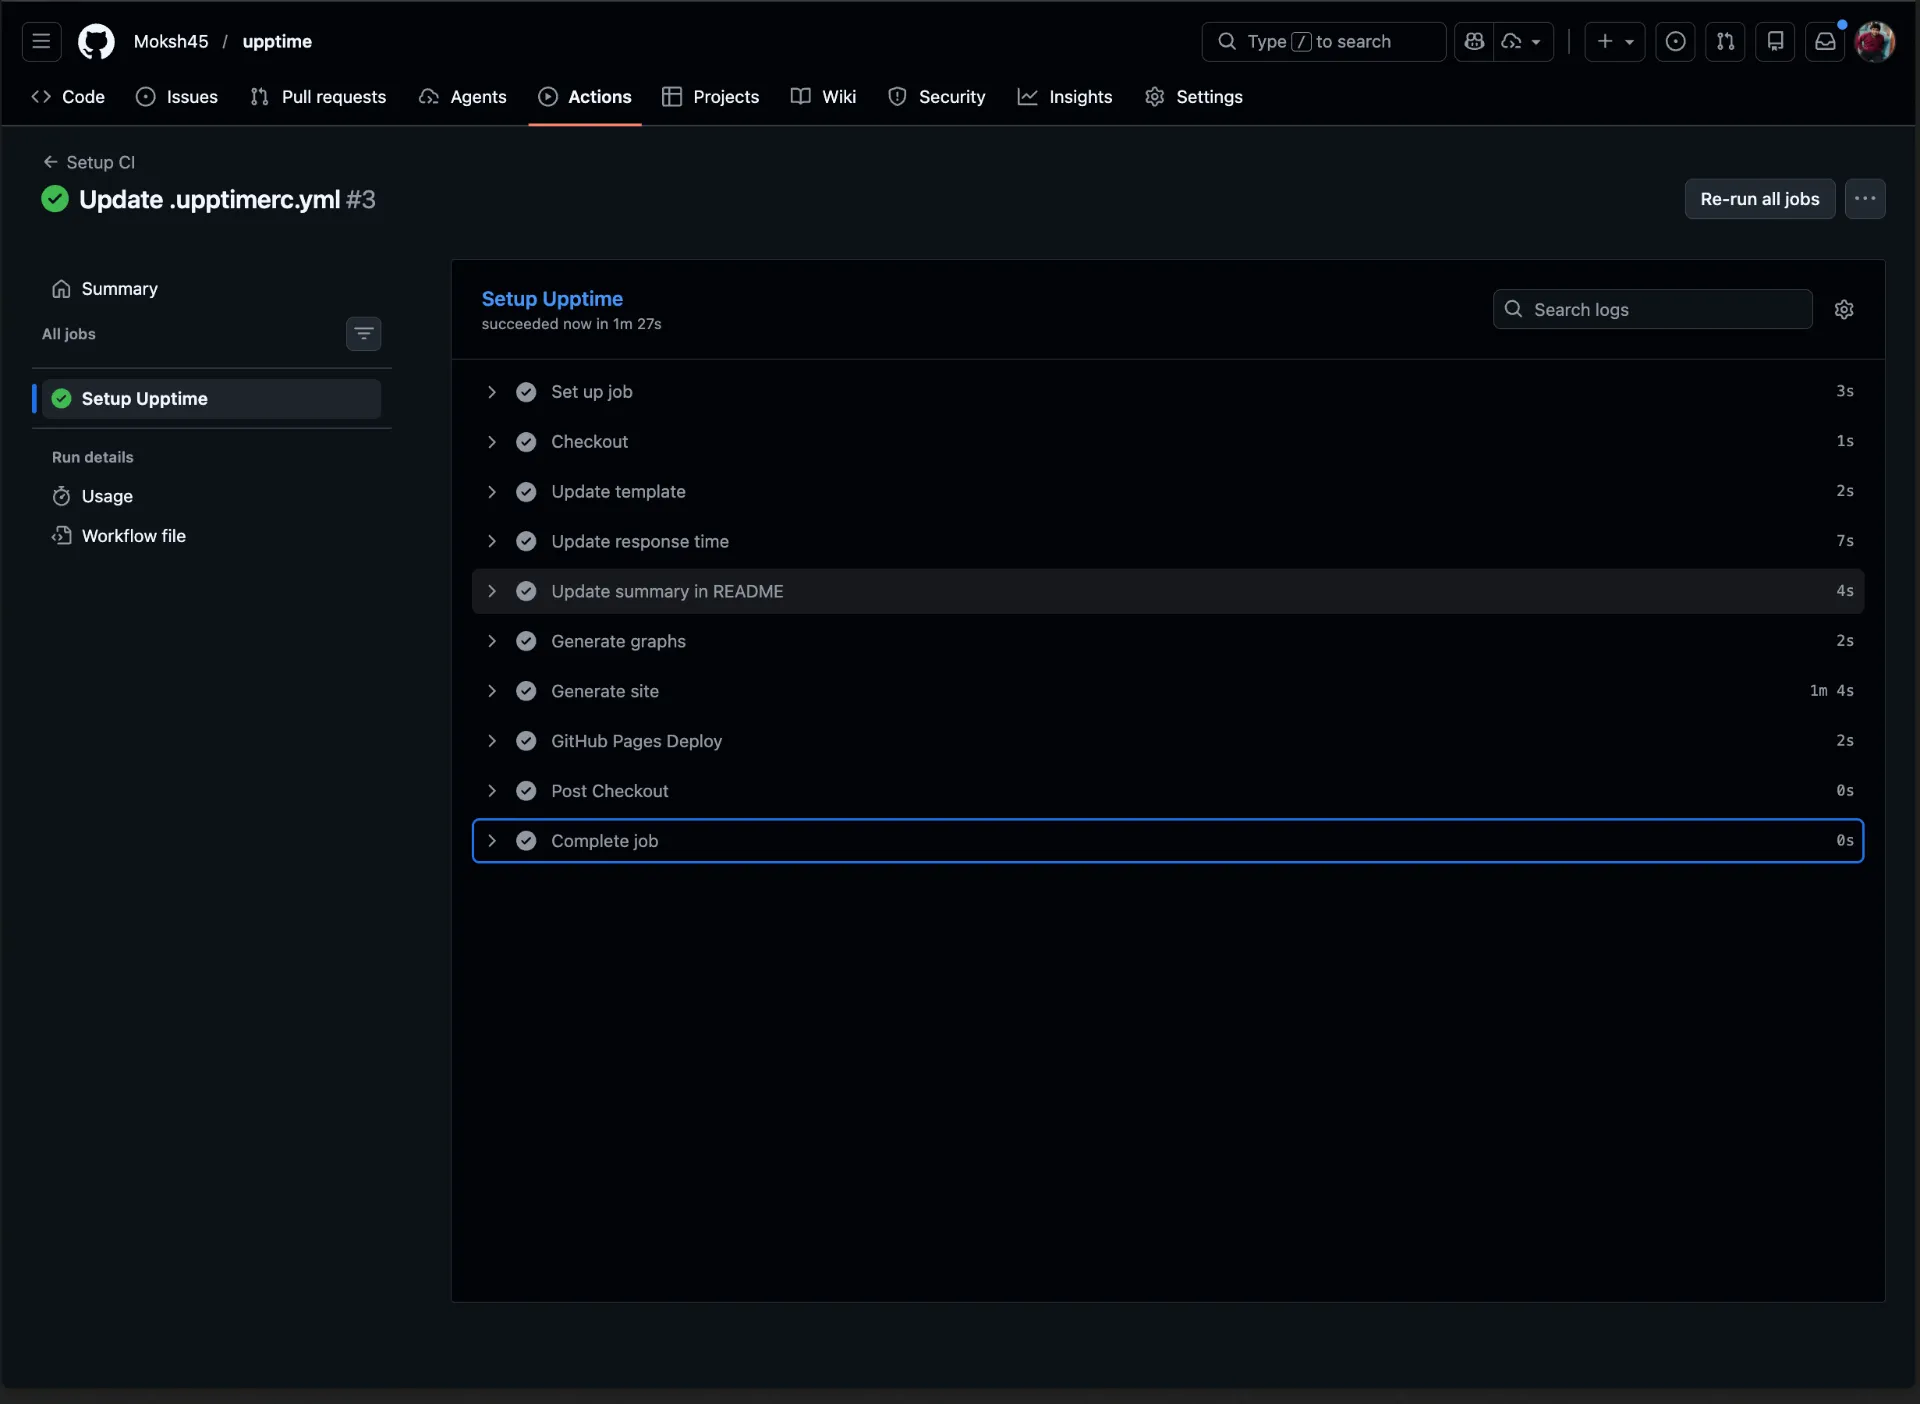
Visit your GitHub Pages URL to see the live status page with your configured endpoints listed and their current uptime percentages.
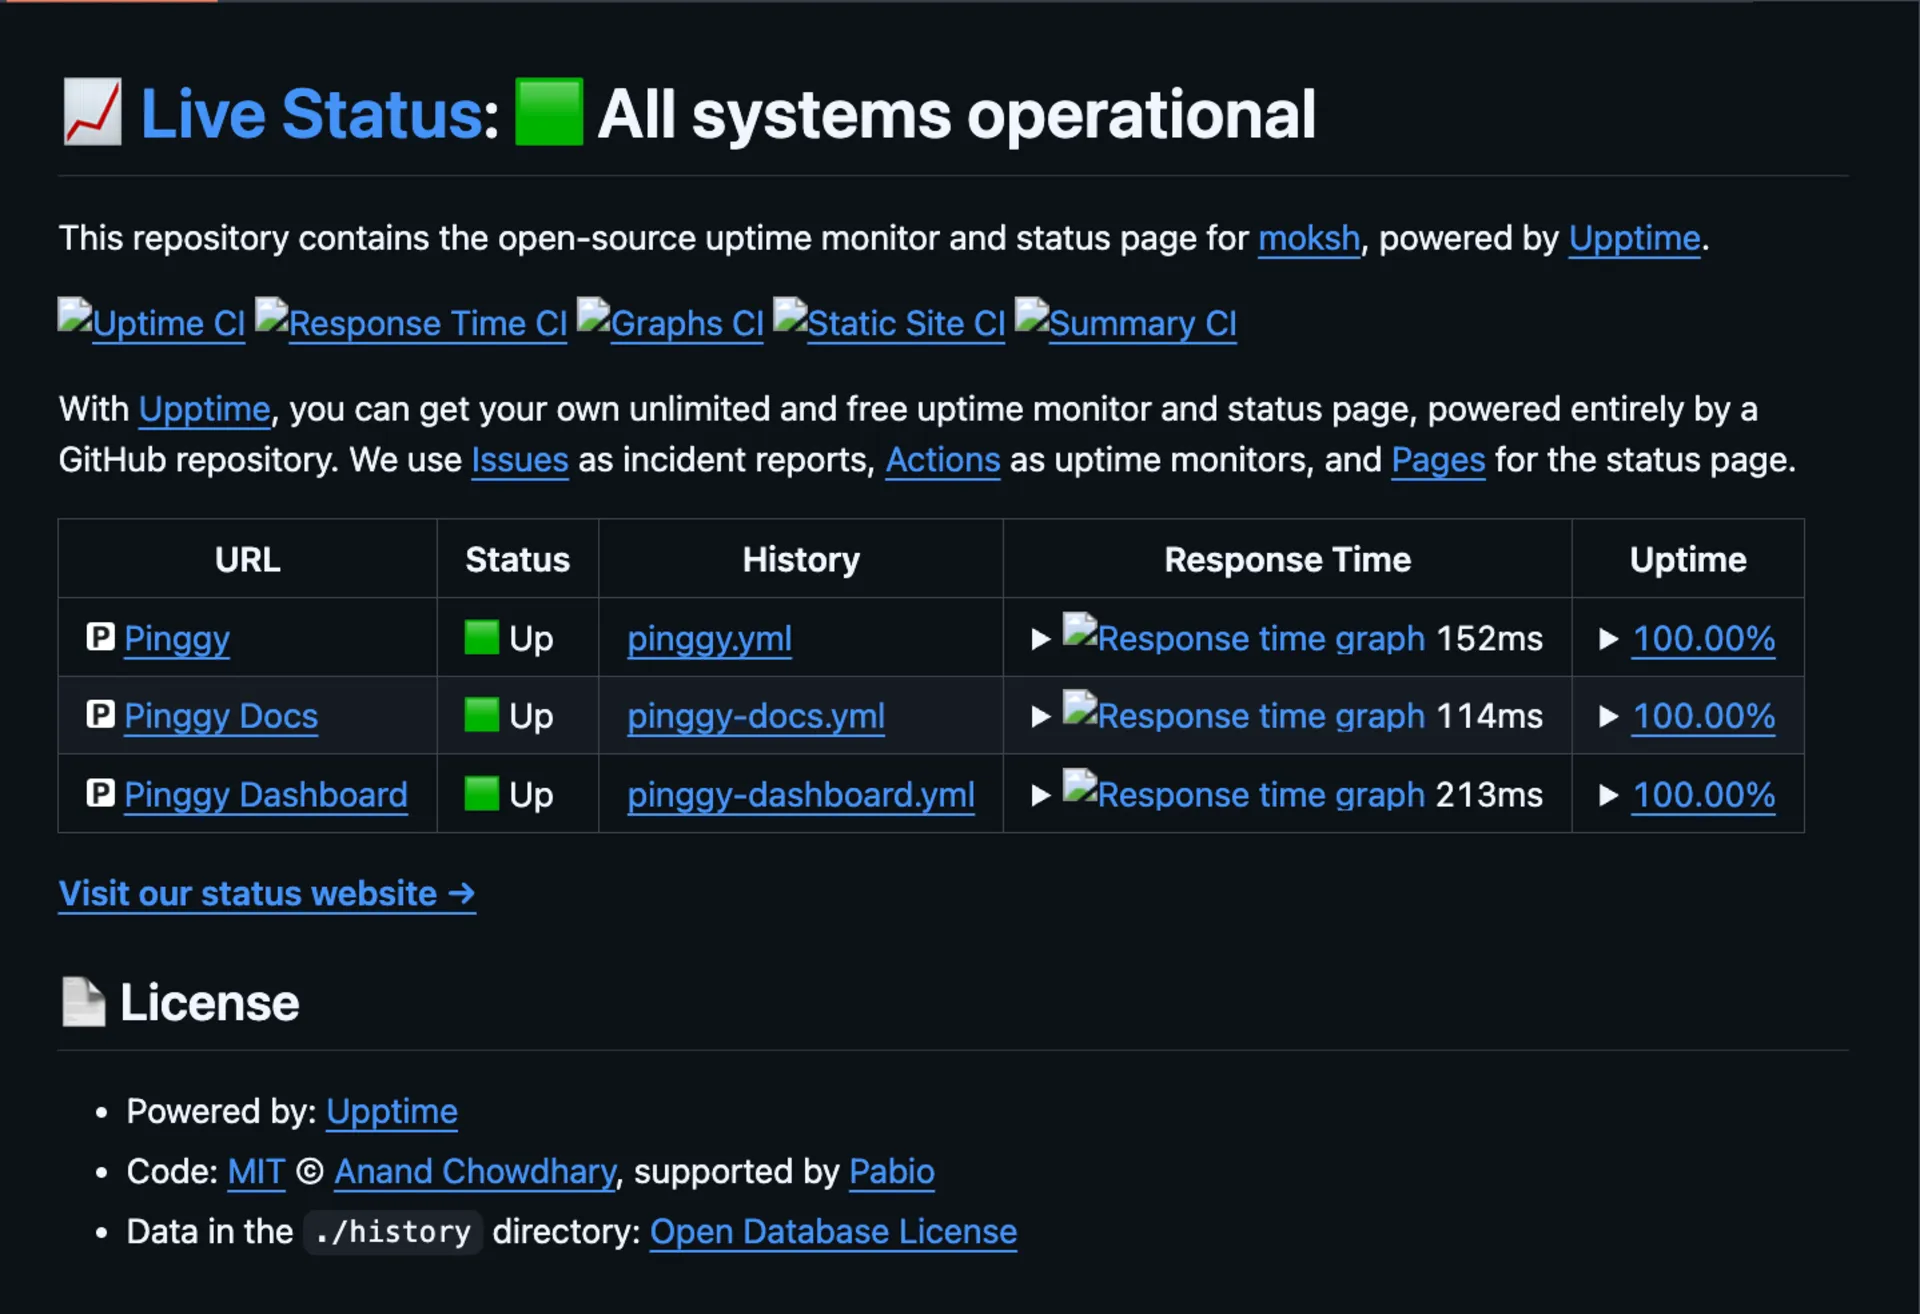
You can also verify directly from your repository’s README. Upptime automatically updates the README with a summary table of all monitored sites, their current status (up or down), uptime percentage over the last 30 days, and response time. If the README shows green status badges and populated uptime data, your monitoring pipeline is fully operational. The README badges are generated from the same JSON endpoints that power Shields.io, so they update automatically with every monitoring cycle.
Advanced Configuration Options
Upptime’s .upptimerc.yml supports a range of configuration options beyond the basics. You can monitor TCP ports instead of HTTP endpoints, which is useful for database servers or custom services:
sites:
  - name: PostgreSQL Database
    url: tcp:your-server.com:5432
You can also set custom expected HTTP status codes or check whether a specific string appears in the response body, which is helpful for detecting partial outages where the server responds with a 200 but serves an error page:
sites:
  - name: Pinggy
    url: https://pinggy.io
    expectedStatusCodes:
      - 200
    body: "Pinggy"
For teams with servers in multiple regions, Upptime supports Globalping integration to run checks from different locations around the world, giving you a more accurate picture of regional availability.
Setting Up Notifications
Knowing your site is down is only useful if someone gets notified. Upptime supports a wide range of notification channels configured directly in .upptimerc.yml. For Slack, you add your webhook URL as a repository secret and reference it in the config:
notifications:
  - type: slack
    webhook: $SLACK_WEBHOOK_URL
Upptime supports Slack, Discord, Telegram, Microsoft Teams, and Zulip for chat notifications. For email, it integrates with SMTP, SendGrid, AWS SES, Mailgun, and Sparkpost. For SMS, it works with Twilio, Nexmo, Infobip, Plivo, and several other providers. Custom webhooks are also supported, giving you the flexibility to pipe incident alerts into any system you already use.
Notification messages include the site name, URL, the HTTP response code, a link to the auto-created GitHub Issue for the incident, and a status emoji. The message template can be customized using variables like $SITE_NAME, $SITE_URL, $ISSUE_URL, and $STATUS.
Embedding Status Badges in Your README
One small but very useful feature is badge support. Upptime generates JSON endpoints for each monitored service that can be used with Shields.io to create uptime and response time badges. You can embed these in your repository’s README to give visitors and contributors instant visibility into service health:


These badges update automatically as Upptime commits new monitoring data, so they always reflect the latest status.
Understanding the Cost Model
Upptime is genuinely free for public repositories. GitHub provides unlimited GitHub Actions minutes for public repos, which means the monitoring workflows which run every 5 minutes, 24 hours a day cost you nothing. GitHub Pages hosting for your status page is also free.
The only scenario where costs apply is if you choose to make your repository private. GitHub charges for Actions minutes on private repositories beyond the free tier (which varies by account plan, but is typically 2,000 minutes per month for free accounts). Since Upptime’s workflows run frequently, a private repo will consume those minutes quickly. For most users, a public monitoring repository is the right choice the data in it is just uptime metrics, which is typically information you would share publicly on a status page anyway.
There are no premium tiers, no feature paywalls, and no per-endpoint pricing. Every capability described in this article is available to anyone with a GitHub account.
Limitations to Keep in Mind
While Upptime is an excellent solution, it is worth understanding where its trade-offs lie. The minimum monitoring interval is 5 minutes, which is determined by how frequently GitHub Actions can be scheduled. If your application requires sub-minute uptime detection, you would need a dedicated monitoring service.
GitHub Actions does not guarantee exact scheduling a cron job set to run every 5 minutes may occasionally run late by a minute or two during periods of high load on GitHub’s infrastructure. This is rarely a practical issue, but worth knowing.
Additionally, the status page is a static site rebuilt by a workflow. It reflects the state of your repository’s data, not a live real-time stream. The page fetches data from the GitHub API to stay current, but there is a small inherent latency compared to a purpose-built monitoring dashboard.
Conclusion
Upptime represents a genuinely clever rethinking of how uptime monitoring can work. By building on top of GitHub’s free, battle-tested infrastructure Actions for automated checks, Issues for incident tracking, and Pages for status page hosting it delivers everything you need to know when your site goes down, without requiring you to pay for yet another SaaS subscription or manage another server.
For solo developers, small teams, open-source projects, and startups watching their cloud bills, Upptime is hard to beat. You get a production-grade monitoring setup with a polished public status page, multi-channel notifications, historical response time graphs, and embeddable badges, all backed by the reliability of GitHub’s infrastructure and the transparency of an open-source codebase.
If you have been putting off setting up uptime monitoring because of cost or complexity, Upptime eliminates both excuses. Visit the Upptime repository and use the template to get started today.